
Analyzing GGA Supercontig Sizes and G+C Content Across Chicken RH Maps
This study explores the characteristics of GGA supercontigs, specifically their sizes measured in kilobases (kb) and the percentage of guanine (G) and cytosine (C) content. It includes insights from the Chicken RH maps linking genetic data with physical mapping positions on HSA1 across different versions of the human genome (Hg17 and Hg18). Key findings will enhance understanding of the genetic architecture in chickens, focusing on supercontig attributes and their implications for avian genetics and breeding programs.

Analyzing GGA Supercontig Sizes and G+C Content Across Chicken RH Maps
E N D
Presentation Transcript
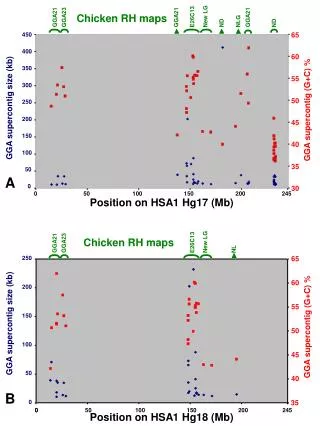
65 450 400 GGA supercontig size (kb) GGA supercontig (G+C) % 60 350 55 300 50 250 0 50 100 150 200 245 Position on HSA1 Hg17 (Mb) 200 45 150 40 100 35 50 0 30 Chicken RH maps New LG E26C13 GGA21 GGA23 GGA21 GGA21 NLG ND ND A Chicken RH maps New LG E26C13 GGA21 GGA23 NL 250 65 60 200 55 150 GGA supercontig size (kb) GGA supercontig (G+C) % 50 100 45 50 40 B 0 35 0 0 50 100 150 200 245 Position on HSA1 Hg18 (Mb)


