Download
1 / 13
130 likes | 152 Vues
Learn about trade-offs, opportunity cost, and the significance of a production possibilities frontier in economics, illustrated with the hypothetical country "Alpha."

E N D
Production Possibility Curves And you
RECAP – Refining our definitions • Trade-offs – alternate decisions to the choices we make. • OpportunityCost – the cost of the next-best alternative. 2nd place. • Important – “cost” doesnot just mean $$$. It means anything of value. It can be quantified in terms of what we lose by choosing otherwise.
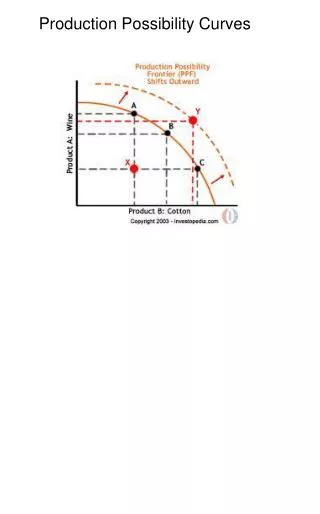
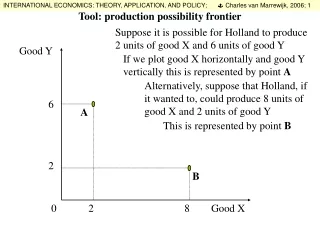
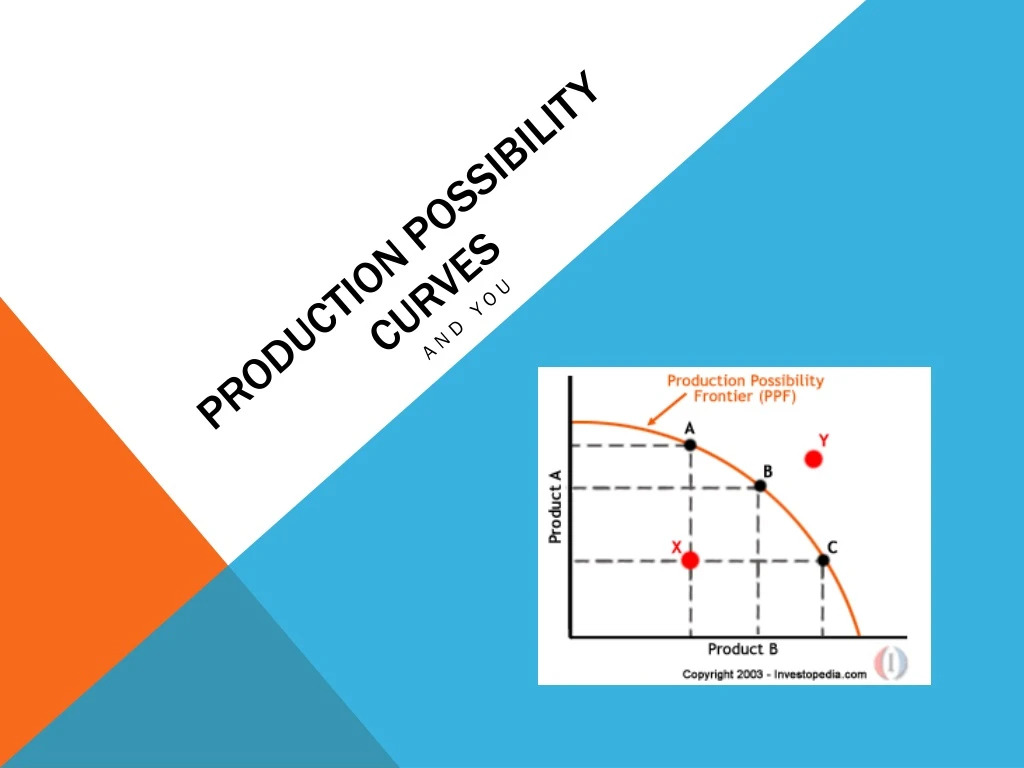
What is a Production Possibilities Frontier? • A diagram representing various combinations of goods and services an economy can produce when all its resources are in use. • Remember: all productive resources must be fully employed for this measure to be accurate.
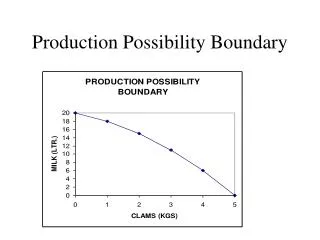
Hypothetical time! • Imagine a mythical country called “Alpha” where they produce only 2 goods: guns and butter. • However, this country (like any real country) has limited resources. • Therefore, choices which affect their gun output have an impact on butter output, and vice-versa.
Another way of putting it… • In Alpha society, the amounts of guns and butter that can be produced are related. They are inversely proportional. • IOW – as the amount of one product goes up, the amount of the other product goes down. And vice-versa.
What does any of that mean? • And why is it important? • In Economics class, we will use graphs and basic math to make sense of many concepts. • Visual representations will (hopefully) make matters clearer
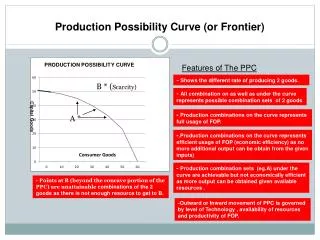
Back to ‘alpha’ • Examine this chart • What do the lines, curve & points mean?
Identifying possible alternatives • Our hypothetical economy only produces 2 goods, but actually has many alternatives on how to utilize its resources. • This is why the curve is called a production possibilities frontier. Many options exist.
Fully employed resources • A and B represent maximum outputs if all resources are fully employed. • Suppose the economy wants to move to point C, which is more guns and more butter. • What happens? • This is why the line is a frontier.
Cost of idle resources • If all resources are not employed, then it is impossible for an economy to reach its full potential (capacity). • What are some reasons for unused resources?
Questions • So if the point is on the arch or on the line it tells you what? • If the point is inside the arch that means what? • If the point is outsideof the graph that means what?
The graph & Opportunity cost • The slope determines the opportunity cost of producing good X in terms of good Y. • Remember Opportunity Cost is the cost of the THING THAT YOUR ARE GIVING UP!!