
Inverting Phase of Thick Objects with DIC Microscopy Technique
E N D
Presentation Transcript
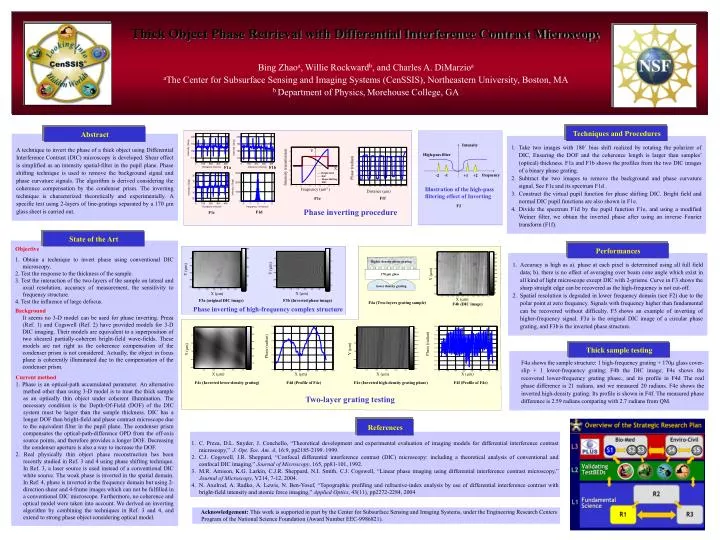
Abstract Intensity A technique to invert the phase of a thick object using Differential Interference Contrast (DIC)microscopy is developed. Shear effect is simplified as an intensity spatial-filter in the pupil plane. Phase shifting technique is used to remove the background signal and phase curvature signals. The algorithm is derived considering the coherence compensation by the condenser prism. The inverting technique is characterized theoretically and experimentally. A specific test using 2-layers of line-gratings separated by a 170 m glass sheet is carried out. High-pass filter frequency -1 +1 +2 -2 Illustration of the high-pass filtering effect of Inverting F2 Higher density phase grating 170 m glass Y (m) Y (m) lower density grating X (m) X (m) F3a (original DIC image) F3b (Inverted phase image) Phase inverting of high-frequency complex structure Thick Object Phase Retrieval with Differential Interference Contrast MicroscopyBing Zhaoa, Willie Rockwardb, and Charles A. DiMarzioaaThe Center for Subsurface Sensing and Imaging Systems (CenSSIS), Northeastern University, Boston, MAb Department of Physics,Morehouse College, GA Techniques and Procedures • Take two images with 180˚ bias shift realized by rotating the polarizer of DIC, Ensuring the DOF and the coherence length is larger than samples’ (optical) thickness. F1a and F1b shows the profiles from the two DIC images of a binary phase grating. • Subtract the two images to remove the background and phase curvature signal. See F1cand its spectrum F1d . • Construct the virtual pupil function for phase shifting DIC. Bright field and normal DIC pupil functions are also shown in F1e. • Divide the spectrum F1d by the pupil function F1e, and using a modified Weiner filter, we obtain the inverted phase after using an inverse Fourier transform (F1f). Y Intensity transmission F1a F1b Phase (radian) X Bright field DIC Phase Shifting DIC Frequency (m-1) Distance (m) F1f F1e Phase inverting procedure F1c F1d State of the Art Objective 1. Obtain a technique to invert phase using conventional DIC microscopy. 2. Test the response to the thickness of the sample. 3. Test the interaction of the two-layers of the sample on lateral and axial resolution, accuracy of measurement, the sensitivity to frequency structure. 4. Test the influence of large defocus. Background It seems no 3-D model can be used for phase inverting. Preza (Ref. 1) and Cogswell (Ref. 2) have provided models for 3-D DIC imaging. Their models are equivalent to a superposition of two sheared partially-coherent bright-field wave-fields. These models are not right as the coherence compensation of the condenser prism is not considered. Actually, the object in focus plane is coherently illuminated due to the compensation of the condenser prism. Performances • Accuracy is high as a). phase at each pixel is determined using all full field data; b). there is no effect of averaging over beam cone angle which exist in all kind of light microscope except DIC with 2-prisms. Curve in F3 shows the sharp straight edge can be recovered as the high-frequency is not cut-off. • Spatial resolution is degraded in lower frequency domain (see F2) due to the polar point at zero frequency. Signals with frequency higher than fundamental can be recovered without difficulty. F3shows an example of inverting of higher-frequency signal. F3a is the original DIC image of a circular phase grating, and F3bis the inverted phase structure. Y (m) X (m) F4a (Two-layers grating sample) F4b (DIC image) Phase (radian) Thick sample testing Phase (radian) Y (m) Y (m) F4a shows the sample structure: 1 high-frequency grating + 170 glass cover-slip + 1 lower-frequency grating; F4b the DIC image; F4c shows the recovered lower-frequency grating phase., and its profile in F4d. The real phase difference is 21 radians, and we measured 20 radians. F4e shows the inverted high-density grating. Its profile is shown in F4f. The measured phase difference is 2.59 radians comparing with 2.7 radians from QM. Current method 1. Phase is an optical-path accumulated parameter. An alternative method other than using 3-D model is to treat the thick sample as an optically thin object under coherent illumination. The necessary condition is the Depth-Of-Field (DOF) of the DIC system must be larger than the sample thickness. DIC has a longer DOF than bright-field and phase contrast microscope due to the equivalent filter in the pupil plane. The condenser prism compensates the optical-path-difference OPD from the off-axis source points, and therefore provides a longer DOF. Decreasing the condenser aperture is also a way to increase the DOF. 2. Real physically thin object phase reconstruction has been recently studied in Ref. 3 and 4 using phase shifting technique. In Ref. 3, a laser source is used instead of a conventional DIC white source. The weak phase is inverted in the spatial domain. In Ref. 4, phase is inverted in the frequency domain but using 2-direction shear and 4-frame images which can not be fulfilled in a conventional DIC microscope. Furthermore, no coherence and optical model were taken into account. We derived an inverting algorithm by combining the techniques in Ref. 3 and 4, and extend to strong phase object considering optical model. X (m) X (m) X (m) X (m) F4c (Inverted lower-density grating) F4d (Profile of F4c) F4e (Inverted high-density grating phase) F4f (Profile of F4e) Two-layer grating testing References • C. Preza, D.L. Snyder, J. Conchello, “Theoretical development and experimental evaluation of imaging models for differential interference contrast microscopy,” J. Opt. Soc. Am. A, 16:9, pp2185-2199. 1999. • C.J. Cogswell, J.R. Sheppard, “Confocal differential interference contrast (DIC) microscopy: including a theoretical analysis of conventional and confocal DIC imaging,” Journal of Microscopy, 165, pp81-101, 1992. • M.R. Arnison, K.G. Larkin, C.J.R. Sheppard, N.I. Smith, C.J. Cogswell, “Linear phase imaging using differential interference contrast microscopy,” Journal of Microscopy, V214, 7-12, 2004. • N. Axelrod, A. Radko, A. Lewis, N. Ben-Yosef, “Topographic profiling and refractive-index analysis by use of differential interference contrast with bright-field intensity and atomic force imaging,” Applied Optics, 43(11), pp2272-2284, 2004 Acknowledgement: This work is supported in part by the Center for Subsurface Sensing and Imaging Systems, under the Engineering Research Centers Program of the National Science Foundation (Award Number EEC-9986821).