Ohio Public Schools Student Growth Analysis Winter 2013
180 likes | 261 Vues
Explore the performance updates of Ohio public school districts under RttT and Non-RttT cohorts. This overview of local LEA data from Conneaut Area Schools in the NE Region highlights the district demographics, performance index gains, graduation rates, and proficiency levels in 3rd-grade reading. Gain insights into student growth trends and compare RttT versus Non-RttT districts in a small town setting with high student poverty. Discover value-added growth metrics for gifted and students with disabilities, and assess district performance against state averages. Stay informed on educational progress in Ohio through this comprehensive analysis.

Ohio Public Schools Student Growth Analysis Winter 2013
E N D
Presentation Transcript
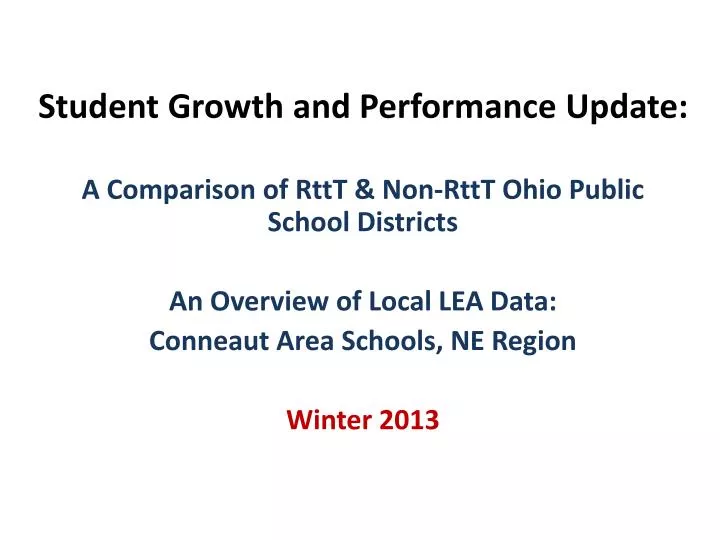
Student Growth and Performance Update: A Comparison of RttT & Non-RttT Ohio Public School Districts An Overview of Local LEA Data: Conneaut Area Schools, NE Region Winter 2013
District Demographics • Type 4 (Small town with high student poverty and average student population) • 1,799 Enrollment • $24,145 Median Income • 62.7% Poverty • 8.5% Minority population • 16.7% Students with Disabilities
Performance Index Gain of 2.4 RttT & Non-RttT Districts(3-year average before RttT and 2012-2013 LRC)
District Performance Index Gain/Loss • Three-year Average before RttT (08-10 LRC) 92.73 • Performance Index 2012-2013 LRC 94.9 • Gain/Loss + 2.17 gain
RttT, Non-RttT & DistrictPerformance Index Gain(3-year average before RttT and 2012-2013 LRC)
Percent of RttTvs Non-RttT DistrictsAdding More than 1 Year’s Growth
Gifted Value Added(based on distribution of scores for the entire state over several years)Percent of districts Adding More than 1 year's Growth
SWD Value Added(based on distribution of scores for the entire state over several years)Percent of districts adding more than 1 year's growth (2012-2013 LRC)
Value Added - Lowest 20% (based on distribution of scores for the entire state over several years)Percent of districts adding more than 1 year's growth 2012-2013 LRC
Value Added Growth – DistrictA = 2 or more year’s growth B = 1 year of growth, but less than 2C = Greater or equal to -1 but less than +1D = Greater or equal to -2 but less than -1F = Less than -2 F - Overall C - Gifted C - Students With Disabilities A - Lowest 20%
RttT/Non-RttT 3rdGrade Reading% at or above Proficient(3-year average before RttT and 2012-2013 LRC)
District - 3rd Grade Reading • 77.3% Three-year average before RttT Percent at or above Proficient • 83.6% 2012-13 LRC • 6.3 % Gain
3rd Grade Reading % at or above Proficient(3-year average before RttT and 2012-2013 LRC)
District Graduation Rate (4 Year) • 2010 Rate 82.3% (“On-time”) • 2012 Rate 83.1% (4-Year Longitudinal) • Gain or Loss: + 0.8%