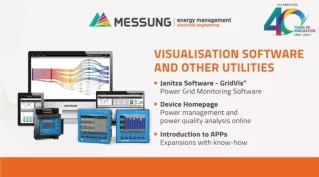
VISUALISATION SOFTWARE AND OTHER UTILITIES FOR ENERGY MANAGEMENT
420 likes | 438 Vues
For Electrical and Maintenance engineers working in Manufacturing and Hospitality sector, the challenge is tosupervise plant-wide energy utilisation and manage their electric infrastructure in a systematic, optimised way.<br>Janitza GmbH is a globally renowned and leading supplier of energy efficiency systems. Their digital energy meters, power quality analysers, digital measurement equipment, universal-measurement devices, power factor controller, peak demand management systems etc. are well acceptedall over the world.

VISUALISATION SOFTWARE AND OTHER UTILITIES FOR ENERGY MANAGEMENT
E N D
Presentation Transcript
UNDERSTANDING SUPERVISORY SYSTEMS www.messungelectricalengineering.com
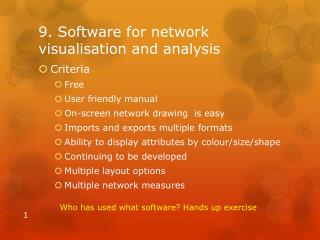
CONTENTS • Features of GridVis Software • Demonstration of GridvisSoftware • GriVis Editions www.messungelectricalengineering.com
JANITZA SOFTWARE • GridVis software • Visualization software for energy management systems and for power quality monitoring. www.messungelectricalengineering.com
THREE APPLICATIONS - ONE SOFTWARE PACKAGE www.messungelectricalengineering.com
REPORTS AUTO DATA COLLECTION WEB DASHBOARDS OTHER DEVICES ANALYSIS CONNECTIVITY GridVis FEATURES WEB ALARMING DATABASE
GridVis FEATURES REPORTS • ANALYSIS • WEB DASHBOARDS • EN 50160, EN 61000-2-4 IEEE 519 evaluation • Uptime analysis as well as statistical analyses • Events, transients and limit violation • Energy overviews • Energy invoice • Residual current analysis • Utilization report • Event browser • Power Quality Analysis • Online and historical graphs • Statistical evaluations • RCM analysis • Professional editor for creating dashboards • Dashboards and templates: free design of overviews • Large number of widgets and functions: • Line, bar and pie charts, heat map, Sankey, key performance indicators (KPI), tables, indicators, duration line, weather, live values, links and much more.
GridVis FEATURES • WEB ALARMING • CONNECTIVITY • AUTO DATA COLLECTION • Monitoring limit values • Alerts via web UI, e-mail or external program • Escalation stages for demand-based alerting • Full access to measurement data and communication parameters • OPC UA client and server (optional) • REST API (M2M solution) • CSV, XLS import & export • MSCONS (load profile, counter data, import and export) • COMTRADE (transients, events export) • Plan device readouts, time synchronization, report generation or e-mail dispatch • Automatic data import • Database management with automation functions • Project backup
GridVis FEATURES • DATABASE • OTHER DEVICES • Integration of third-party devices via Modbus/TCP or Modbus/RTU (RS-485) • Water, Air, Gas & Flow meters • Jan DB (database in the scope of delivery) • MySQL (driver) • MSSQL (driver)
VIRTUAL MEASUREMENT DEVICES Virtual Device Main Transformer 415 V Bus Dept. 3: HVAC Dept. 4: Compressor Dept. 1: Workshop Dept. 2: Manufacturing
VIRTUAL DEVICE VIRTUAL DEVICE
MANUFACTURING PLANT SCHEMATIC SHED No: 1 M/C-1 M/C-2 Ethernet Switch GridVis Software/Device Homepage UMG 512 PRO M/C-3 M/C-4 UMG 509-PRO SHED No: 2 Point of Common Coupling(PCC) M/C-2 M/C-1 Main Transformer M/C-5 M/C-3 UMG 509-PRO SHED No: 3 M/C-1 M/C-2 Ethernet TCP/IP M/C-4 M/C-3 UMG 509-PRO SHED No: 4 M/C-2 M/C-1 M/C-3 M/C-4 UMG 509-PRO www.messungelectricalengineering.com
DEVICE HOMEPAGE • Access to the powerful meter-homepage via webbrowser • No software installation necessary • Real-time data, historical data etc. directly accessible via the meter home page • Possibility to control the device remotely • Password protection possible
APPs • UMG 509-PRO • UMG 512-PRO • UMG 605-PRO • UMG 604-PRO
APP-PUSH SERVICE • Sending data directly from the device to the energy portal (without additional software) • The delivery of data is implemented via port 80 • Data can be saved in a MySQL database automatically • Data can be visualized via a web server by means of a web browser • Only Jasic-capable devices are supported (UMG 604-PRO / UMG 605-PRO / UMG 509-PRO and UMG 512-PRO) • UMG 96RM-EL with integrated Push App function is supported.
THANK YOU Contact us MESSUNG SYSTEMS PVT. LTD. 501, 502 & 503 Lunkad Sky Vista, Viman Nagar, Pune, India - 411 014. +91 20 6649 2800 | info@messung.com www.messungelectricalengineering.com