Download
1 / 37
370 likes | 391 Vues
Hospital admissions per patient, by modality figure 5.1, prevalent patients. Hospital days per admission & per patient year at risk, by modality figure 5.2, prevalent patients. Hospital admissions per patient figure 5.3, prevalent ESRD patients, 1998. Hospital admissions per patient.

E N D
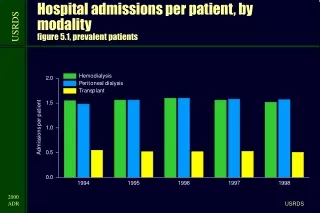
Hospital admissions per patient, by modalityfigure 5.1, prevalent patients USRDS
Hospital days per admission & per patient year at risk, by modalityfigure 5.2, prevalent patients USRDS
Hospital admissions per patientfigure 5.3, prevalent ESRD patients, 1998 Hospital admissions per patient USRDS
Hospital days per admissionfigure 5.4, prevalent ESRD patients, 1998 Hospital days per admission USRDS
Hospital days per year at riskfigure 5.5, prevalent ESRD patients, 1998 Hospital days per year at risk USRDS
Hospital days per year at riskfigure 5.6, prevalent hemodialysis patients, 1998 Hospital days per year at risk USRDS
Hospital days per year at riskfigure 5.7, prevalent peritoneal dialysis patients, 1998 Hospital days per year at risk USRDS
Hospital days per year at riskfigure 5.8, prevalent transplant patients, 1998 Hospital days per year at risk USRDS
Hospital days per year at riskfigure 5.9, prevalent diabetic ESRD patients, 1998 Hospital days per year at risk USRDS
Hospital days per year at riskfigure 5.10, prevalent non-diabetic ESRD patients, 1998 Hospital days per year at risk USRDS
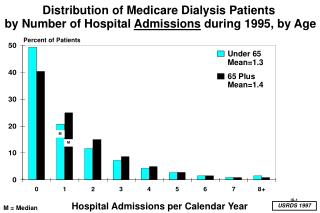
Hospital admissions by age groupfigure 5.11, prevalent patients, 1996-1998 USRDS
Hospital admissions by racefigure 5.12, prevalent patients, 1996-1998 USRDS
Hospital admissions by diabetic statusfigure 5.13, prevalent patients, 1996-1998 USRDS
Hospital days per year by age group& race: Hemodialysisfigure 5.14, prevalent patients, 1996-1998 USRDS
Hospital days per year by age group & race: Peritoneal dialysisfigure 5.14, prevalent patients, 1996-1998 USRDS
Hospital days per year by age group& race: Transplantfigure 5.14, prevalent patients, 1996-1998 USRDS
Hospital days per year by age group& race: All dialysisfigure 5.14, prevalent patients, 1996-1998 USRDS
Hospital days per year by age group & diabetic status: Diabeticsfigure 5.14, prevalent patients, 1996-1998 USRDS
Hospital days per year by age group & diabetic status: Non-diabeticsfigure 5.14, prevalent patients, 1996-1998 USRDS
Frequency of vascular access procedures, hemodialysisfigure 5.15, prevalent hemodialysis patients, 1998 USRDS
Frequency of infection (overall), hemodialysisfigure 5.15, prevalent hemodialysis patients, 1998 USRDS
Frequency of infection (vascular access), hemodialysisfigure 5.15, prevalent hemodialysis patients, 1998 USRDS
Frequency of cardiovascular (overall) diagnoses, hemodialysisfigure 5.15, prevalent hemodialysis patients, 1998 USRDS
Frequency of heart catheterizations, hemodialysisfigure 5.15, prevalent hemodialysis patients, 1998 USRDS
Frequency of amputations, hemodialysisfigure 5.15, prevalent hemodialysis patients, 1998 USRDS
Frequency of catheter complications, peritoneal dialysisfigure 5.16, prevalent peritoneal dialysis patients, 1998 USRDS
Frequency of infection (overall), peritoneal dialysisfigure 5.16, prevalent peritoneal dialysis patients, 1998 USRDS
Frequency of infection (peritonitis) peritoneal dialysisfigure 5.16, prevalent peritoneal dialysis patients, 1998 USRDS
Frequency of cardiovascular (overall) diagnoses, peritoneal dialysisfigure 5.16, prevalent peritoneal dialysis patients, 1998 USRDS
Frequency of heart catheterizations, peritoneal dialysisfigure 5.16, prevalent peritoneal dialysis patients USRDS
Frequency of amputations, peritoneal dialysisfigure 5.16, prevalent peritoneal dialysis patients USRDS
Asian Asian N. Am. N. Am. Black Black White White Hospital days for cardiovascular & amputation proceduresfigure 5.17, prevalent dialysis patients, 1998 USRDS
Asian Asian N. Am. N. Am. Black Black White White Hospital days for heart catheterizations & revascularizationsfigure 5.18, prevalent dialysis patients, 1998 USRDS
Asian Asian N. Am. N. Am. Black Black White White Hospital days for access infections & complicationsfigure 5.19, prevalent dialysis patients, 1998 USRDS
Hospital admissions per patientsfigure 5.20, incident & prevalent transplant patients USRDS
Development of new diagnosesfigure 5.21, prevalent ESRD patients without a prior history of the diagnosis USRDS
Development of new diagnoses (cont.)figure 5.21, prevalent ESRD patients without a prior history of the diagnosis USRDS