Figure 5.1 Membrane Molecular Structure
Figure 5.1 Membrane Molecular Structure. Outside of cell. Extracellular matrix. Phospholipid. Cytoskeleton. Inside of cell. In-Text Art, Ch. 5, p. 64. “Head”. “Tails”. In-Text Art, Ch. 5, p. 65. Outside of cell (aqueous). Hydrophobic interior of bilayer. Inside of cell (aqueous).
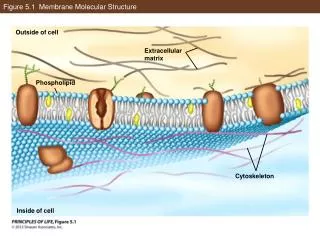

Figure 5.1 Membrane Molecular Structure
E N D
Presentation Transcript
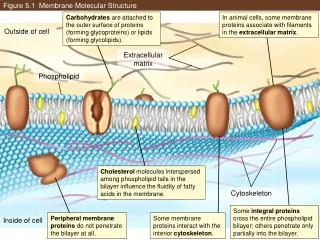
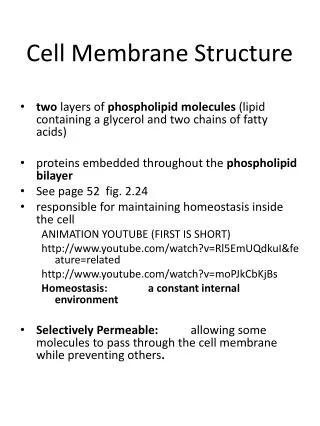
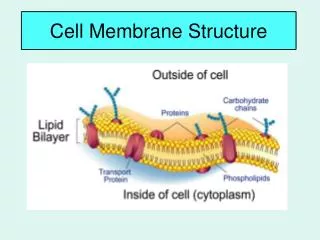
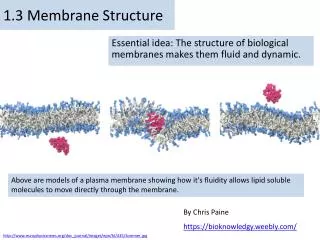
Figure 5.1 Membrane Molecular Structure Outside of cell Extracellular matrix Phospholipid Cytoskeleton Inside of cell
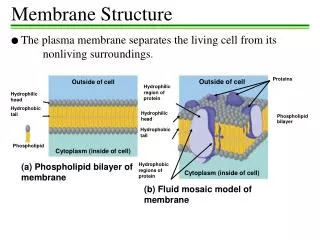
In-Text Art, Ch. 5, p. 64 “Head” “Tails”
In-Text Art, Ch. 5, p. 65 Outside of cell (aqueous) Hydrophobic interior of bilayer Inside of cell (aqueous)
Figure 5.2 Rapid Diffusion of Membrane Proteins (Part 1) Proteins embedded in a membrane can diffuse freely within the membrane. Membrane proteins Mouse cell Human cell
Figure 5.2 Rapid Diffusion of Membrane Proteins (Part 2) Proteins embedded in a membrane can diffuse freely within the membrane. Membrane proteins Mouse cell Human cell Heterokaryon Membrane proteins can diffuse rapidly in the plane of the membrane.
Figure 5.2 Rapid Diffusion of Membrane Proteins (Part 3) The experiment was repeated at various temperatures with the following results: Cells with mixed proteins (%) Temperature (C) 0 15 20 26 0 8 42 77 Plot these data on a graph of Percentage Mixed vs. Temperature. Explain these data, relating the results to the concepts of diffusion and membrane fluidity.
Figure 5.3 Osmosis Can Modify the Shapes of Cells (Part 1) Hypertonic on the outside (concentrated solutes outside) Isotonic (equivalent solute concentration) Hypotonic on the outside (dilute solutes outside) Inside of cell Outside of cell
Figure 5.3 Osmosis Can Modify the Shapes of Cells (Part 2) Hypertonic on the outside (concentrated solutes outside) Isotonic (equivalent solute concentration) Hypotonic on the outside (dilute solutes outside) Animal cell (red blood cells)
Figure 5.3 Osmosis Can Modify the Shapes of Cells (Part 3) Hypertonic on the outside (concentrated solutes outside) Isotonic (equivalent solute concentration) Hypotonic on the outside (dilute solutes outside) Plant cell (leaf epithelial cells)
Figure 5.4 A Ligand-Gated Channel Protein Opens in Response to a Stimulus Outside of cell Stimulus molecule (ligand) Binding site Channel protein Hydrophobic interior of bilayer Hydrophilic pore Closed channel Inside of cell
Figure 5.5 Aquaporins Increase Membrane Permeability to Water (Part 1) Aquaporin increases membrane permeability to water. Aquaporin mRNA Aquaporin channel Protein synthesis
Figure 5.5 Aquaporins Increase Membrane Permeability to Water (Part 2) Aquaporin increases membrane permeability to water. Aquaporin mRNA Aquaporin channel Protein synthesis 3.5 minutes in hypotonic solution Aquaporin increases the rate of water diffusion across the cell membrane.
Figure 5.5 Aquaporins Increase Membrane Permeability to Water (Part 3) Oocytes were injected with aquaporin mRNA (red circles) or a solution without mRNA (blue circles). Water permeability was tested by incubating the oocytes in hypotonic solution and measuring cell volume. After time X in the upper curve, intact oocytes were not visible: X With mRNA Without mRNA Relative volume Time (min) • A. Why did the cells increase in volume? • B. What happened at time X? • C. Calculate the relative rates (volume increase per minute) of swelling • in the control and experimental curves. What does this show about • the effectiveness of mRNA injection?
Figure 5.6 A Carrier Protein Facilitates Diffusion (Part 1) Outside of cell High glucose concentration Glucose Glucose carrier protein Inside of cell Low glucose concentration
Figure 5.6 A Carrier Protein Facilitates Diffusion (Part 2) Rate of diffusion into the cell Glucose concentration outside the cell
Figure 5.7 Primary Active Transport: The Sodium–Potassium Pump Outside of cell High Na+ concentration, low K+concentration Na+ Na+– K+ pump K+ K+ ATP Pi Na+ Pi Pi ADP Pi K+ Inside of cell High K+ concentration, low Na+ concentration
Figure 5.8 Endocytosis and Exocytosis (Part 1) (A) Endocytosis Outside of cell Plasma membrane Inside of cell Endocytotic vesicle
Figure 5.8 Endocytosis and Exocytosis (Part 2) (B) Exocytosis Secretory vesicle
Figure 5.9 Receptor-Mediated Endocytosis (Part 1) Clathrin molecules Cytoplasm Coated vesicle Outside of cell Specific substance binding to receptor proteins Coated pit
Figure 5.9 Receptor-Mediated Endocytosis (Part 2) Outside of cell Specific substance binding to receptor proteins Coated pit Cytoplasm Coated vesicle Clathrin molecules
Figure 5.10 Chemical Signaling Concepts Receptor Secreting cell Target cell Target cell Circulatory vessel (e.g., a blood vessel) Target cell
Figure 5.11 Signal Transduction Concepts Signal molecule Receptor Short-term responses: enzyme activation, cell movement Activated signal transduction molecule Inactive signal transduction molecule Long-term responses: altered DNA transcription
Figure 5.12 A Signal Binds to Its Receptor Ligand Outside of cell Cell membrane Inside of cell
In-Text Art, Ch. 5, p. 76 Signal molecule Receptor RL R + L
Figure 5.13 A Protein Kinase Receptor Signal (insulin) Outside of cell Receptor ATP Protein kinase domain (inactive) ADP Phosphate groups Target Cellular responses Inside of cell
Figure 5.14 A G Protein–Linked Receptor (Part 1) Outside of cell Signal (hormone) GDP G protein-linked receptor Inactive effectorprotein Inactive G protein Inside of cell
Figure 5.14 A G Protein–Linked Receptor (Part 2) Outside of cell GTP Activated G protein Inside of cell
Figure 5.14 A G Protein–Linked Receptor (Part 3) Outside of cell Activated effector protein GDP Product Reactant Amplification Inside of cell
Figure 5.15 The Discovery of a Second Messenger (Part 1) A second messenger mediates between receptor activation at the plasma membrane and enzyme activation in the cytoplasm. Liver Cytoplasm contains inactive glycogen phos-phorylase Membranes contain epinephrine receptors
Figure 5.15 The Discovery of a Second Messenger (Part 2) A second messenger mediates between receptor activation at the plasma membrane and enzyme activation in the cytoplasm. Active glycogen phosphorylase is present in the cytoplasm. A soluble second messenger, produced by hormone-activated membranes, is present in the solution and activates enzymes in the cytoplasm. The activity of previously inactive liver glycogen phosphorylase was measured with and without epinephrine incubation, with these results: Enzyme activity (units) Condition Homogenate Homogenate + epinephrine Cytoplasm fraction Cytoplasm + epinephrine Cytoplasm + membranes Cytoplasm + membranes + epinephrine 0.4 2.5 0.2 0.4 0.4 2.0 What do these data show? Propose an experiment to show that the factor that activates the enzyme is stable on heating and give predicted data. Propose an experiment to show that cAMP can replace the particulate fraction and hormone treatment and give predicted data.
Figure 5.16 The Formation of Cyclic AMP (Part 1) Adenylylcyclase cAMP + PPi ATP
Figure 5.16 The Formation of Cyclic AMP (Part 2) Adenine Phosphate groups ATP
Figure 5.16 The Formation of Cyclic AMP (Part 3) Cyclic AMP (cAMP)
Figure 5.17 A Cascade of Reactions Leads to Altered Enzyme Activity (Part 1) Epinephrine Outside of cell 1 ActivatedG proteinsubunit Plasma membrane Epinephrinereceptor Activatedadenylylcyclase GTP ATP cAMP 20 Active glycogensynthase Inactive protein kinase A Active protein kinase A 20 Inactive glycogensynthase Inactive phosphorylase kinase 100 Active phosphorylase kinase
Figure 5.17 A Cascade of Reactions Leads to Altered Enzyme Activity (Part 2) 100 Active phosphorylase kinase Inactive glycogen phosphorylase 1,000 Active glycogen phosphorylase Glycogen 10,000 Glucose 1-phosphate Glucose Inside of cell 10,000 Blood glucose Outside of cell
Figure 5.18 Signal Transduction Regulatory Mechanisms (Part 1) Protein kinase ATP P Inactiveenzyme Activeenzyme Proteinphosphatase Pi
Figure 5.18 Signal Transduction Regulatory Mechanisms (Part 2) Receptor binding InactiveG protein ActiveG protein GTP GDP GTPase
Figure 5.18 Signal Transduction Regulatory Mechanisms (Part 3) Adenylylcyclase Phosphodiesterase AMP cAMP ATP
Figure 5.19 Caffeine and the Cell Membrane (Part 1) Outside of cell Plasmamembrane Inside of cell
Figure 5.19 Caffeine and the Cell Membrane (Part 2) Adenosine Caffeine