Download
1 / 1
10 likes | 288 Vues
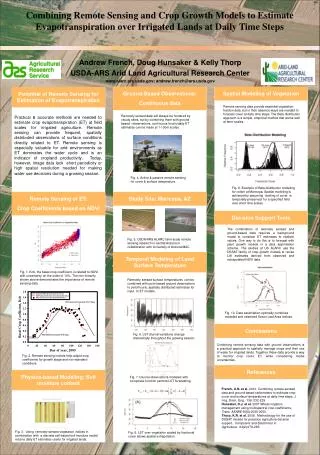
Combining Remote Sensing and Crop Growth Models to Estimate Evapotranspiration over Irrigated Lands at Daily Time Steps. Andrew French, Doug Hunsaker & Kelly Thorp USDA-ARS Arid Land Agricultural Research Center www.alarc.ars.usda.gov; andrew.french@ars.usda.gov. Ground-Based Observations:

E N D
Combining Remote Sensing and Crop Growth Models to Estimate Evapotranspiration over Irrigated Lands at Daily Time Steps Andrew French, Doug Hunsaker & Kelly Thorp USDA-ARS Arid Land Agricultural Research Center www.alarc.ars.usda.gov; andrew.french@ars.usda.gov Ground-Based Observations: Continuous data Spatial Modeling of Vegetation Potential of Remote Sensing for Estimation of Evapotranspiration Remote sensing data provide essential vegetation fraction data, but in their absence ways are needed to forecast cover at daily time steps. The Beta distribution approach is a simple, empirical method that works well at farm-scales. Remotely sensed data will always be hindered by cloudy skies, but by combining them with ground based –observations, continuous hourly/daily ET estimates can be made at 1-100m scales. Practical & accurate methods are needed to estimate crop evapotranspiration (ET) at field scales for irrigated agriculture. Remote sensing can provide frequent, spatially distributed observations of surface conditions directly related to ET. Remote sensing is especially valuable for arid environments as ET dominates the water cycle and is an indicator of cropland productivity. Today, however, image data lack short periodicity or high spatial resolution needed for making water use decisions during a growing season. Fig. 4. Active & passive remote sensing for cover & surface temperature. Fig. 9. Example of Beta distribution modeling for cotton at Maricopa. Spatial modeling is achieved by assuming ranking of cover is temporally preserved for a specified field over short time scales. Remote Sensing of ET: Crop Coefficients based on NDVI Study Site: Maricopa, AZ Increased on-farm water use efficiency Decision Support Tools The combination of remotely sensed and ground-based data requires a background model to constrain ET estimates to realistic values. One way to do this is to forecast with plant growth models in a data assimilation scheme. The studies at US ALARC use the DSSAT family of crop growth models to revise LAI estimates derived from observed and extrapolated NDVI data. Fig. 5. USDA/ARS ALARC farm-scale remote sensing research in central Arizona in collaboration with University of Arizona/MAC. Temporal Modeling of Land Surface Temperature Fig. 1. Kcb, the basal crop coefficient, is related to NDVI with uncertainty on the order of 10%. The non-linearity shown above demonstrates the importance of remote sensing data. Remotely sensed surface temperatures can be combined with point-based ground observations to yield hourly, spatially distributed estimates for input to ET models. Fig. 10. Data assimilation optimally combines modeled and observed Green Leaf Area Indices. Conclusions Fig. 6. LST diurnal variations change dramatically throughout the growing season. Combining remote sensing data with ground observations is a practical approach to spatially manage crops and their use of water for irrigated lands. Together these data provide a way to monitor crop cover, ET, while considering model uncertainties. Fig. 2. Remote sensing indices help adjust crop coefficients for growth stage and non-standard conditions. References Physics-based Modeling: Soil moisture content Fig. 7. Diurnal observations modeled with composite function permits LST forecasting French, A.N. et al. 2010. Combining remote sensed data and ground-based radiometers to estimate crop cover and surface temperatures at daily time steps. J. Irrig. Drain. Eng. 136: 232-239. Hunsaker, D.J. et al. 2007 Wheat irrigation management using multispectral crop coefficients, Trans. ASABE 50(6):2035-2050. Thorp, K.R. et al. 2008. Methodology for the use of DSSAT models for precision agriculture decision support. Computers and Electronics in Agriculture. 64(2):276-285. References Fig. 3. Using remotely sensed vegetation indices in combination with a discrete cell-based soil moisture model returns daily ET estimates useful for irrigated lands. Fig. 8. LST over vegetation scaled by fractional cover allows spatial extrapolation.