Download
1 / 4
40 likes | 138 Vues
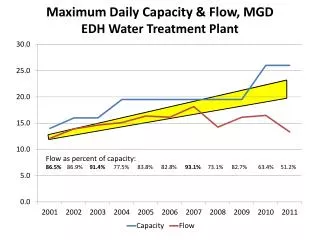
Analyzing daily capacity and flow rates of MGDEDH and Deer Creek water treatment plants. Evaluating water supply and demand (acre feet per year) against legal entitlement and physical availability.

E N D
Maximum Daily Capacity & Flow, MGDEDH Water Treatment Plant Flow as percent of capacity: 86.5% 86.9% 91.4% 77.5% 83.8% 82.8% 93.1% 73.1% 82.7% 63.4% 51.2%
Capacity & Flow:Deer Creek Wastewater Treatment Plant Flow as percent of capacity: 99.6%102.5% 71.7% 70.3% 70.0% 74.7% 72.2% 66.1% 66.1%
Water Supply & Demand, acre feet per year(Supply: legal entitlement, physical availability)