Download
1 / 20
200 likes | 454 Vues
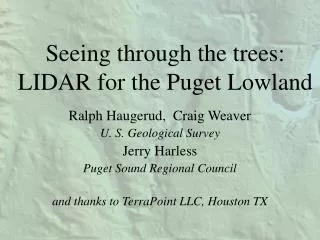
Seeing through the trees: LIDAR for the Puget Lowland. Ralph Haugerud, Craig Weaver U. S. Geological Survey Jerry Harless Puget Sound Regional Council and thanks to TerraPoint LLC, Houston TX. Why LIDAR? What is LIDAR? How are we doing LIDAR? What are we finding?.

E N D
Seeing through the trees: LIDAR for the Puget Lowland Ralph Haugerud, Craig Weaver U. S. Geological Survey Jerry Harless Puget Sound Regional Council and thanks to TerraPoint LLC, Houston TX
Why LIDAR? • What is LIDAR? • How are we doing LIDAR? • What are we finding?
In some places, it is easy to see where the active faults are. 30 km
In other places, it is not. Seattle Tacoma 30 km
age slip rate = feature size 18,000 yr 1 mm/yr = 18 m 106 yr 1 mm/yr = 1 km In the Puget Lowland, to see a fault with the same slip rate as in the SF Bay area, we have to look more closely.
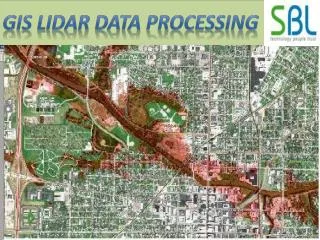
LIght Detection And Ranging • Airborne scanning laser rangefinder • Differential GPS • Inertial Navigation System 30,000 points per second at ~15 cm accuracy • $400–$1000/mi2, 106 points/mi2, or 0.04–0.1 cents/point Extensive filtering to remove tree canopy (virtual defor-estation)
Uses for high-resolution topography • Finding faults (earthquake frequency, kinematics) • Geologic mapping • Landslide hazards • Flood hazards, groundwater infiltration, runoff modelling • Fish habitat • Precision forestry • Noise propagation
Why is LIDAR better than photogrammetry?(It’s the trees) Suppose timber allows 1 of 3 arbitrary rays to reach ground; 1/3 of ground can be surveyed by LIDAR Photogrammetry requires 2 separate views of a point; only 1/9 of ground will be locatable
Bainbridge Island,KPUD1996-1997 Seattle Snoqualmie, USGS-NMD 1998-2001? Tacoma
Puget Sound LIDAR Consortium • No formal structure • One agenda • One contract • Separate payments • Share data • Release all data to public domain (www.GetItYourselfBob, to be hosted by UW library)
PSLC Feb 2001 Seattle March-April 2000, Feb 2001 Tacoma
~$3M LIDAR already flown Seattle to be flown Winter 2001-2002 Tacoma ~$3.3M
15 km west of Seattle Toe Jam Hill fault scarp Waterman Point scarp beach uplifted during 900 AD earthquake