Voting and Voter Turnout
320 likes | 602 Vues
Voting and Voter Turnout. Overview. Voter turnout data - the trends To vote or not to vote?. Voter Turnout. Is voting important in democratic politics? Why?. Voter Turnout. 2008 Presidential Primary Election data, Hudson County Board of Election

Voting and Voter Turnout
E N D
Presentation Transcript
Overview • Voter turnout data - the trends • To vote or not to vote?
Voter Turnout • Is voting important in democratic politics? • Why?
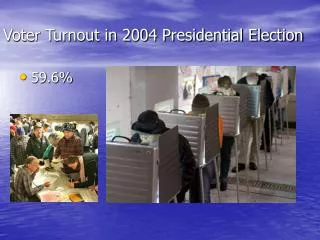
Voter Turnout • 2008 Presidential Primary Election data, Hudson County Board of Election • 2008 School Board election data, Hudson County Board of Election • 2004 Presidential Election data, Hudson County Board of Election • Voter Turnout Data, US Bureau of the Census
Voter Turnout • Voter Turnout Data, US Elections Project* *corrected for ineligible voters
Voting • To Vote or Not to Vote
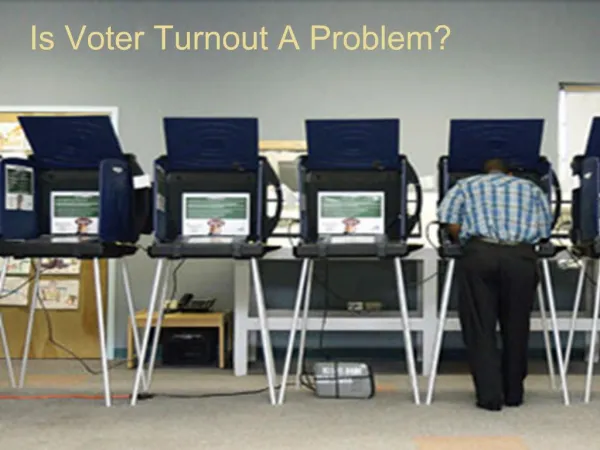
Voter Turnout • However we measure turnout, the US numbers are significantly lower than those of most other democratic countries • Is this a problem? Should we care? How significant is voting in democratic politics?
Voter Turnout • If we examine data over time, we find that US voter turnout in presidential elections increased fairly steadily from 1924 to 1940, dropped during WW2, and returned to prewar levels in the 1950s • Turnout held relatively steady from 1952 to 1968, when we began to see a slow steady decline (except for 1992 and 2004)
Paradox of Not Voting • In order to understand how to improve voter turnout, we ought to first examine why people vote in the first place • Voting is a costly act -- it takes time and effort (both to go to the polls and to stay informed about the choices available)
Paradox of Non Voting • To help us, let’s postulate a hypothetical Obama supporter (“Joe”) in the 2008 presidential election trying to decide whether to stay home and watch Sportscenter or go to the polls • To help us balance the costs and benefits of voting, we’ll introduce two key concepts:Utility and Expected Utility
Utility & Expected Utility • Utility is derived from 19th century economics, and is used to represent the satisfaction derived from different experiences or conditions Jeremy Bentham John Stuart Mill
Utility & Expected Utility • So our voter, Joe, could have an assortment of utilities on election day: watching Sportscenter (Us), Obama elected (Uo), McCain elected (Um), etc.
Utility & Expected Utility • The concept of Expected Utility is a bit more complicated, in that here we try to take into account not only the utility of various outcomes, but also the probability that each outcome will occur • This is a particularly helpful idea in situations where the outcome is uncertain
Utility & Expected Utility • For example, suppose you decide the key to your financial success is to play a lottery with the following payoff chances:80% chance of winning $520% chance of winning $100 • What’s the expected monetary value of the ticket?
Utility & Expected Utility • Probability of each outcome summed or:(.8 * $5) + (.2 * $100)$4.00 + $20.00 = $24.00 • Expected Utility is calculated the same way, except we don’t use money, we just use the more general idea of “utility” • So let’s get back to Joe, our hypothetical voter
Expected Utility of Voting • We can calculate the investment benefits of voting for Obama • The choice is between: Obama vs. McCain and voting, and Obama vs. McCain and not voting • The investment benefits would be the difference in expected utility from the two outcomes
Expected Utility of Voting • Symbolically, we can represent this as: ∆O * B where: ∆O = effect of Joe’s vote on Obama’s election and B is the difference in expected utility between an Obama win and and a McCain win (Uo - Um)
Expected Utility of Voting • What is the cost of voting then? • Remember Joe had at least one other option (watching SportsCenter) so we have to weigh that into our calculations (call it Us) or, since we can’t do that activity if we vote, call it the cost of voting, or “c.” • Given the preceding, then, when should Joe vote?
Expected Utility of Voting • Joe should vote if the following holds true: ∆O * B > c
Expected Utility of Voting • How do we determine the size of ∆O? • In other words, what is the effect of Joe’s voting on the probability that Obama will win?
Expected Utility of Voting • Joe’s vote can change the probability that Obama will win in two cases: 1. when the election is a tie without the vote and Joe’s vote decides the election for Obama; or2. when the election is a one vote win for McCain and Joe’s vote makes creates a tie
Expected Utility of Voting • Joe’s vote doesn’t matter if:Obama is leading by one vote or more orIf McCain is winning by 2 or more votes,
Expected Utility of Voting • That of course means that unless the election is a tie, or McCain is winning by a vote then:∆O * B = 0, regardless of the size of B
Paradox of Not Voting • If we consider voting power as a function of the pool of outcomes in which your vote can change the result; • If we take the raw numbers from the 2004 election in New Jersey, where 3,611,691 voters cast ballots in the Kerry/Bush race • Then your voting power is:
Paradox of Not Voting 1/3,611,691 or 0.00000002%
Expected Utility of Voting • Now, given that beyond perhaps some municipal elections, the vast majority of US elections are not likely to be decided by a single vote, then for any cost of voting, a rational voter should not vote • And note, voter turnout is lowest in those elections when voters have the highest likelihood of influencing the result (ie., local elections)
Expected Utility of Voting • This is particularly the case in presidential elections, where the only difference to be made is in a single state where the electoral votes of that state are also decisive for an Obama victory • So that voting is a presidential election is not rational for voters
Expected Utility of Voting • Turnout in this light seems amazingly high • Tens of millions of Americans do vote, so either something is wrong with our model, or tens of millions of Americans are irrational • So, we need to revisit the model and address three questions:
Conclusion • Why are some people willing to vote even though it isn’t rational? • Why do people vote? • Can we recreate the conditions and incentives that lead some people to vote and extend to the nonvoting public?
Conclusion • It is tempting to say that people derive greater satisfaction from the simple act of voting (what we call the consumption benefits, or those benefits which derive simply from participating in the act itself regardless of the potential impact of the vote); so that:
Conclusion ∆O * B + D > c where D = consumption benefits
Expected Utility of Voting • But saying “because they get greater satisfaction from voting than not voting” just begs the question. • We need to try to determine or identify possible sources of these consumption benefits.