Download
1 / 32
320 likes | 521 Vues
VOTER TURNOUT in the 2012 Election. Presented by. Nonprofit VOTE is the nation’s largest provider of voter engagement resources and trainings designed specifically for nonprofits to help them to integrate nonpartisan voter participation into their ongoing activities and services.

E N D
VOTER TURNOUTin the 2012 Election Presentedby
Nonprofit VOTE is the nation’s largest provider of voter engagement resources and trainingsdesigned specifically for nonprofits to help them to integrate nonpartisan voter participation into their ongoing activities and services. Nonprofit VOTE is voter participation partner of the National Association of Secretaries of State for the nonprofit sector Visit our website for more on our mission and partners: www.nonprofitvote.org
Today’s presenters Julian Johannesen Director of Research and Training Nonprofit VOTE Sophie Lehman Communications Director Nonprofit VOTE Who
agenda • Measuring Voter Turnout • Voter Turnout in Presidential Elections • The Swing State and Election Day Registration Effects • The Youth Vote • The Latino Vote • Gaps in Voter Turnout by Demographic • Improving Voting and Elections Agenda
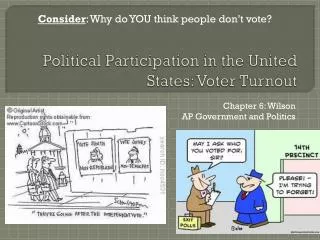
Measuring voter turnout • Common Measurements • As a % of Registered Voters • As a % of Eligible Voters • Voter Turnout • Highest Office and Total Turnout • Voting Eligible Population • 18 and over, citizen, ex-offender Measuring Voter Turnout
Turnout demographics • What is the National Election Exit Poll? • What does the NEEP report? • Share of the vote by demographics • Issue preferences • Partisan choice • The Census’ Current Population Survey Voting and Registration Supplement • Voter turnout estimates by demographic • Available in the spring after the election Measuring Voter Turnout
http://elections.nytimes.com/2012/results/president/exit-pollshttp://elections.nytimes.com/2012/results/president/exit-polls http://www.cnn.com/election/2012/results/race/president
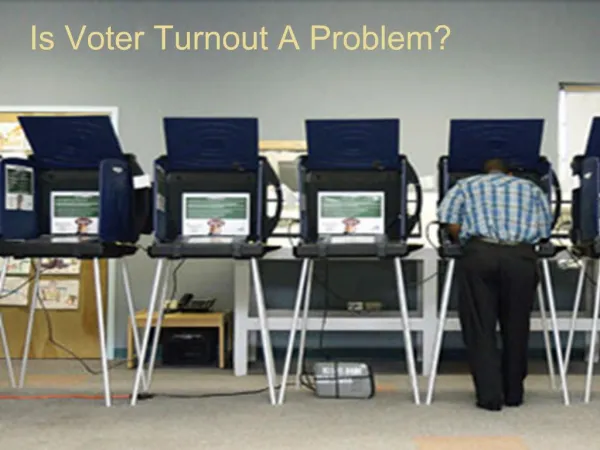
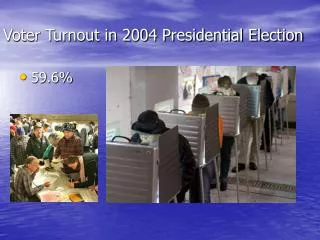
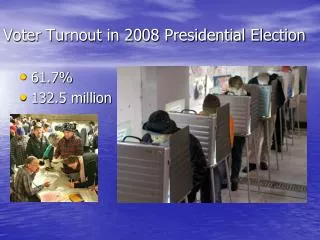
VOTER TURNOUT IN 2012 • 58.7% of voting eligible citizens turned out to vote in the 2012 presidential election, about 130.3 million voters • Turnout was dragged down by low turnout in the large states like California, New York, and Texas Voter Turnout 2012
FACTORS AFFECTING TURNOUT Many factors affect state turnout, e.g. whether there are other competitive races on the ballot or a controversial ballot measure – and the mobilization that goes with that. But the two strongest predictors of state voter turnout are: • Whether a state is a swing state • Whether a state has Election Day registration Voter Turnout 2012
SWING STATES AND ELECTION DAY REGISTRATION
SWING STATES • What is a “Swing State?” • Turnout in the 10 swing states was 65.2%, 7.2 points higher than in non-swing states, which had an average turnout of 58%. • Five of the ten states with the highest turnout in 2012 were swing states Swing and EDR
SWING STATES AND SPENDING Swing and EDR Source: Washington Post Online, “Mad Money: TV ads in the 2012 presidential campaign”
ELECTION DAY REGISTRATION • What is “Election Day registration?” • In 2012, states with Election Day registration had average turnout of 71.3%, 12.5 points higher than the turnout in states without EDR. Those states had an average turnout rate of 58.8%. • Five of the ten states with the highest turnout in 2012 have some form of Election Day registration. Swing and EDR
YOUTH VOTE AND LATINO VOTE
YOUTH VOTE • Young voters increased their share of the electorate by one point, from 18% in 2008 to 19% in 2012 • The youth vote was a determining factor in four swing states. • Youth turnout was especially high in swing states – an estimated 58%, compared to just 47% in non-swing states. • Young voters were the most racially and ethnically diverse segment of the electorate. Youth and Latino
LATINO VOTE & THE RISING ELECTORATE • In 2012, the Latino share of the vote rose to 10%. • Latino turnout is estimated at 53%, that’s six points below the national average. Roughly 12.5 million Latinos voted out of a voting eligible population of about 23.7 million. • Latino voters are a crucial voting bloc in many states, including swing states like Colorado, Florida, and Nevada. In Colorado the Latino share of the vote was 14%, in Florida 17%, and in Nevada 18%, all higher than in 2008 Youth and Latino
LATINO VOTE & THE RISING ELECTORATE Youth and Latino
Other notable trends • The African American vote held steady at 13% of the electorate and may have surpassed the white vote in percent turnout • API share of vote grew to 3%. With a 47% partisan gap favoring Obama over Romney • Early voting continued to rise but more slowly. 35% voted early. Youth and Latino
VOTER TURNOUT GAPS
VOTER TURNOUT GAPS Gaps
VOTER REGISTRATION MODERNIZATION • Online, paperless voter registration • Election Day Registration or same-day registration during early voting periods Registration Modernization
VOTER REGISTRATION MODERNIZATION • Pre-registration for young people • Active voter registration Registration Modernization
info@nonprofitvote.org 617.357.VOTE (8683) www.nonprofitvote.org Nonprofit VOTE 89 South Street Suite 203 Boston, MA 02111 Sophie Lehman sophie@nonprofitvote.org Julian Johannesen julian@nonprofitvote.org