Oceanography
Oceanography. Last Updated 2013 Miss Rabatin. Water World… What % of H 2 0 is in the Ocean?. Where is the Water?. Salinity of Oceans, What in there???. Surface of Salinity.

Oceanography
E N D
Presentation Transcript
Oceanography Last Updated 2013 Miss Rabatin
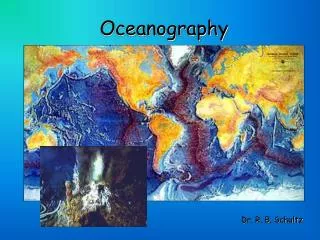
As water travels through the water cycle, some water will become part of The Global Conveyer Belt and can take up to 1,000 years to complete this global circuit. It represents in a simple way how ocean currents carry warm surface waters from the equator toward the poles and moderate global climate.
Where did the Water Come From? • Volcanism and Outgassing • Mantle produced early atmospheric rich gases • Earth cooled and water condensed and oceans formed • See Pg 30 “Origin of the Oceans” • Extraterrestrial in Origin?
Boxed Reading: Origin of the Oceans • Age of Earth: approximately 4 billion years • Water from interior of Earth • Mantle • Gas that escape volcanoes is 70% water vapor • 4 billion years at current rate 100 times the volume of the oceans • Water from outer space • 10 million comets enter the atmosphere each year • Layer of water 0.0025 mm deep added each year • 4 billion years at current rate 2 to 3 times the volume of the oceans
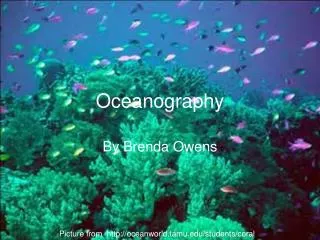
Dissolved salts insea water (atoms): 55.3 % Chlorine 30.8 % Sodium 3.7 % Magnesium 2.6 % Sulfur 1.2 % Calcium 1.1 % Potassium Introduction: • Ocean • 70% of Earth is Water • 97% of water • Moderates Temp. and Weather • 1/3 of Petroleum • Life in ocean for 3 b.y. before coming to land • We are made of water • % of salt in our bodies proportional to ocean salt • Live in water for 9 months • Formed by trapped water vapor • Cooled and then condensed
Earth’s Water 2.6 • Reservoirs and residence time • Large reservoirs long residence time • Small reservoirs short residence time • Distribution of land and water • Northern Hemisphere (land) • Southern Hemisphere (water) • Oceans • Hypsographic curve
World’s Water • N. Hemisphere • 60.7% Sea • 39.3% Land • S. Hemisphere • 80.9% Sea • 19.1% Land • Ocean’s Deepest Spot? • Mariana Trench 11,022 m • Pacific Ocean Google Earth
Location of Position on Earth • Latitude- Imaginary gridlines on Earth that run east to west. • Known as parallels • Equator = 0° • Poles = 90°N and 90°S • Longitude- Imaginary gridlines on Earth that run north to south. • Known as Meridians • Prime Meridian = 0° • International Date Line = 180° • Lines East of PM = + • Lines West of PM = -
Location Systems 2.4 • Latitude and longitude • Latitudes (or parallels) are parallel to the equator • Longitudes (or meridians) are formed at right angles to the latitude lines • Prime meridian and international date line • Great Circle • Nautical mile • Chart and maps • Distorted images of Earth’s curved surface • Projection types: cylindric, conic, and tangent
2.4 con’t • Measuring latitude • North Star, Polaris • Longitude and time • Use of clocks to record the time the Sun is at its zenith • Greenwich Mean Time (GMT) or Universal Time
Measuring Latitude • Measure the angle between the horizon and polaris (the north star) http://www.pbs.org/weta/roughscience/series1/challenges/latlong/page3.html
Measuring Longitude • Difficult!! • Needed Chronometer • Clocks didn’t keep accurate time on ships! Why? • 15° = 1 hour • Reference longitude = Prime meridian • Greenwich Mean Time GMT • Now called Universal Time UT or Zulu Time for Zero Meridian • Time zones • 15° of longitude wide
Identification of Point on Earth’s Surface • Crossing of Latitude and Longitude • 158°W, 21°N = Hawaiian Islands • 20°E, 33°S = Cape of Good Hope • 41.473°N, -81.537°W = Shaker Heights, Ohio • 1° Latitude = 60 Nautical Miles • 1° of arc = 60’ minutes of arc • 1’ of arc = 60” seconds of arc ( °, ', " ) Shaker Heights is at 41° 47’ (minutes) 3” (seconds)
The Nautical Mile / Sea Mile • Measurement of Length • 1 NM ~ 1.8 km = 1.15 mi • 1NM = 1’ of latitude http://content.answers.com/main/content/wp/en-commons/7/79/Nautic_mile_definition_v2.png
Finding Distances Between Locations • Length of between longitudes at equator = 69.2 mi • Length of between longitudes at 80° = 10.47 mi • 0 mi at the poles • Length of a degree of longitude = cos (latitude) * 69.2 miles EX 1 degree of longitude at 40° Distance = cos (40) * 69.2 miles = .7660 * 69.2
Modern National Techniques 2.5 • Radar (radio detecting and ranging) • Loran (long-range navigation) • Satellite navigation system • Global Positioning System (GPS) • Shipboard computers • Electronic atlas • Surface charts • Bathymetry • Continuous tracking of ship’s position
Charts and Maps 2.4 • Topographic Maps (topography) • Maps that show lines connecting points of similar elevation • Bathymetric Maps (bathymetry) • Charts of the ocean showing contour lines connecting points of the same depth below the sea surface • Physiographic Maps • Color, shading, and perspective drawings may be added to simulate topography and produce visual representations or bird’s-eye views
Topographic Map http://www.jesseshunting.com/images/topo-bench-saddle1.jpg
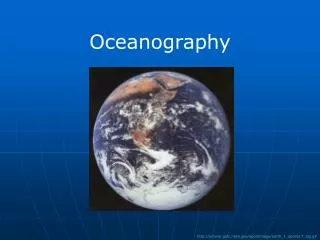
The Water Planet • Distance from the Sun = 93 million miles • Earth’s mean surface temperature = 16° C (61 °F) • What protects Earth from temperature extremes • Moderated by rotation of Earth on axis • Atmospheric Gases act like blanket • Orbit of Earth around Sun • All of the above allow earth to have liquid water! • Ocean’s cover 362 million km2 (140 million mi2) • 71% water • Volume of Ocean’s are 1.35 billion km3
Where’s the Water • Ocean • River • Lakes • Ground water • Glaciers • Vapor in atmosphere • Reservoir - place where water resides • Movement though the water reservoirs = hydrologic cycle
Residence Time • Average Length of time that a water molecule spends in any one reservoir • Water is replaced in the atmosphere about 29 times every year • 13,000 km3 of water in atmosphere at any one time • Evaporation from ocean/land • Ocean = 320,000 km3 • Land = 60,000 km3 • Precipitation returned from ocean/land • Ocean = 284,000 km3 • Land = 96,000 km3 • Excess runs off to rivers, streams, ocean and ground water