Download

1 / 51
510 likes | 572 Vues
Discover key insights from the 2014 Myanmar Population and Housing Census on occupation and industry data collection, coding procedures, and labor force frameworks. Learn about economic activity status, labor force participation rates, and more.

E N D
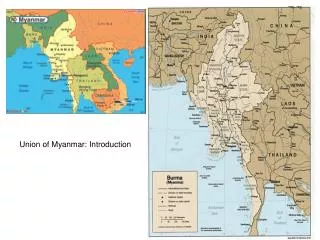
The Republic of the Union of Myanmar Ministry of Immigration and Population With support from UNFPA
The 2014 Myanmar Population and Housing Census Census Report Volume 2-B Occupation and Industry
Census Report Volume 2-B Occupation and Industry
Outline • Background • Coding of the information • Labour Force Framework (ILO) • Highlight of the Results • Next Steps
Background • Census enumeration took place in March/April 2014 • Provisional results (Census Volume 1) were released in August 2014 • Main Results were launched by H.E. President in May 2015; the reports were: • Union Report, Volume 2 • Highlights of the Main Report, Volume 2-A • 15 State/Region Reports, one for each State and Region, Volume 3 –(1-15) • Wall Chart with indicators down to District level
Background • This report on “Occupation and Industry: Census Report Volume 2-B” is part of the Union Report • It contains 2 of the 4 outstanding data from the census • In progress are dissemination and utilization of census results at State/Region as well as district levels; done in all States/Regions and in 70 out of 74 districts • Process of preparing 13 Thematic Reports is in progress and will be published during year 2016
Coding of Occupation and Industry • Occupation and Industry were written as free text during enumeration, hence cannot be captured using OMR or ICR technology • Census Office developed the coding index for occupation and industry based on international guidelines (ISCO 2008 and ISIC Revision 4) • To improve quality of coding, each questionnaire was coded by two operators(“double-blind” coding) • If the two operators coded differently, the questionnaire automatically went to the supervisor to make a determination on the correct code
Data Collection and processing • Information on occupation and industry was collected only for those who were working. • Occupation data was collected and processed based on the International Standard Classification of Occupations (ISCO 2008) at a 3 digit level. • Industry data was collected and analyzed using the International Standard Industrial Classification of All Economic Activities (ISIC Rev 4) at a 2 digit level.
Labour Force Framework (ILO) • The analysis of economic characteristics data collected in the 2014 Census uses the standard labour force framework, as prescribed by the International Labour Organization (ILO) • This framework categorizes the population aged 15 years and over into two mutually exclusive groups: • the economically active population or ‘labour force’, and • the economically inactive population
Labour Force Framework (ILO) • The economically active population or ‘labour force’ consists of the population aged 15 years and above who were working during the reference period, and also those who were not working but were actively seeking a job • The economically inactive population covers the population aged 15 years and above who neither work nor are seeking to work, e.g. those incapacitated to work, unpaid household workers, retired, full-time students and those who sat at home but not looking for work
Occupation and industry groups • Data on occupation and industry in this report are presented by major groupings (this is referred to as 1 digit level by ILO) i.e. the major grouping is defined as a set of jobs whose tasks and duties are characterised by a high degree of similarity • Major groups are summarised from detailed sub-groups for both occupation and industry, • This is annexed in the Report
Occupation categories example All 3 digit occupations below are recorded as the 1 digit occupation ‘Skilled Agricultural, Forestry and Fishery Workers’
Industry categories example All of the 2 digit industries below are recorded as the 1 digit industries ‘Mining and quarrying’
Economic Activity Status • According to the employment status, 21.9 million people aged 15 years and over are employed in Myanmar. This is out of 35.9 million people in that age range. • Of these 39 per cent (8.5 mil) were employees (both government and private organizations); • 44 per cent (9.7 mil) were self-employed (employers and own account workers); and • 17 per cent (3.7 mil) were contributing family workers
Economic Activity Status Most people were own account workers, at over 40% Many females were unpaid family workers 26% compared to 11% for males
Labour Force Participation Rate • Labour Force Participation Rate is the percentage of employed and unemployed people to the total population. • Total population include: • employed, • unemployed and • economically inactive people • Labour Force Participation Rate is 67 per cent at the Union level, this means that 67 per cent of people aged 15-64 years were either employed or actively looking for a job during the year before the census • Also, that 23 percent of the population were economically inactive
Labour Force Participation Rate • There is a clear difference between LFP rates for women and men although the difference decreases by old age
Labour Force Participation by S/R LFP rate in Shan is almost 20% higher than in Rakhine, why?
Employment-to-population ratio • A more robust measurement of employment is the employment-to-population (ETP) ratio • ETP ratio is the proportion of employed people to the total population. Total population include, employed, unemployed and economically inactive people • The employment-to-population ratio is 64.4 per cent at the Union level, this means that 64 per cent of people aged 15-64 years were employed during the reference period at the Union level
Employment-to-population ratio • The ratio is much higher for males at 81% than for females at 48%. • Females mostly do unpaid household work (39% compared to 1% of men).
Employment-to-population ratio by State/Region The ETP ratio is higher among males 82%, than females 48% Highest in Shan state 76%, lowest in Rakhine 53%
Unemployment rate • Unemployment rate, as defined by ILO, only takes into account people aged 15 – 64 years who are not working but are actively looking for job, as a percentage of people who are economically active (employed, unemployed) • The unemployment rate at the time of the census was 4 per cent • Unemployment rates for males and females are almost similar at the Union level, at 3.9 per cent and 4.1 per cent, respectively
Unemployment rate by age • The youth (aged 15-24) unemployment rate at 9.4%, is more than double that of the Union average (4%)
Employment by industry • The percentage of employed people working in the industry of “Agriculture, Forestry and Fishing” was highest among both males (55.4%) and females (47.4%). • It was 52.2% nationally and employed 10.7 million people • The second highest industry was “Wholesale, retail trade including spare parts for repair of motor vehicles and motorcycles” at 7.2% for males and 12.6% for females. • It employed 1.9 million people
Employment by industry (contd.) • Third highest industry was “Manufacturing” at 6.8% both sexes, it employed 1.4 million people • Fourth was “Accommodation and Food Services Activities” that employed 4.7% or 962 thousands people • Fifth industry was “Construction” with 4.6% or 940 thousand people • About 616,000 people (3%) reported to be under “Public Administration including Civil Servants” • An estimated 390,000 and 112,000 people (1.9% and 0.5%) were in “Education” and “Health” industries, respectively.
Employment by industry and gender • Examining the sex composition, males work mostly in: • “Agriculture forestry and fishing” (55.4%) • “Wholesale and retail trade; repair of motor vehicles and motorcycles” (7.2%) • “Construction” (6.8%) • “Transportation and storage” (6.4%) • “Manufacturing” (4.9%)
Employment by industry and gender • Examining the sex composition, females work mostly in: • “Agriculture, forestry and fishing” (47.4%) • “Wholesale and retail trade; including sales spares of motor vehicles and motorcycles” (12.6%) • “Manufacturing” (9.7%) • “Accommodation and food service activities” (7%) • “Education” (3.9%)
Agriculture, Forestry and Fishing Over 70% of those employed in Chin work under this category as opposed to 52% at the Union level and only 16% in Yangon
Wholesale and retail Trade Most of the wholesale and retail trade occurs in Yangon at 16%, followed closely by Kachin with 12%
Manufacturing Yangon and Mandalay are the only Ss/Rs where manufacturing is at a higher level than the whole Union with 15% and 11%, respectively
Construction Construction is highest in Ss/Rs with larger urban areas although unexpectedly Mon ranks second highest at over 6%
Accommodation and food service Shan and Kayah, as well as Chin record the lowest percentages of employees in this sector at well below average 2% and 0.5%, respectively
Child Labour (aged 10-17 years) • An estimated 1.54 million children aged 10-17 years reported working according to the census; 840,000 males and 700,000 females • About 43% or 670,000 worked for pay • By industry of those in employment, 61% (816,000) were in “agriculture” while 10% (136,000) in “Manufacturing” • 6.4% (87,000) in wholesale and retail” and 5.4% (74,000) in construction • 4.5% (61,000) in accommodation and service industry
Employment by occupation • The proportion of employed persons aged 15 and over by occupation was highest in “Agricultural Forestry and Fishery Workers” at 42.9% -8.8 million people • This was followed by “Elementary occupations” (16% or 3.3 million people ) • Elementary “occupations” consist of simple and routine tasks which mainly require the use of hand-held tools and often require some physical effort. Because of the physical strength required many more males are in this category
Employment by occupation • The third occupation is “Service and sales workers” (13% - 2.6 million people) • “Craft and related trade workers” was also high, reportedly employing 12 % 0r 2.4 million of all employed persons. • The “Managers, Senior officials and Legislators” were only 0.6% or 128,000 people • “Professionals” were about 490,000 accounting for 2.4%
Employed persons by occupation (Union) • The number of skilled Agricultural Forestry and Fishery workers are highest among employed persons.
Employed persons by occupation by sex • The number of services and sales workers and Professionals are much higher for women
Employed persons by occupation by urban/rural • The number of services and sales workers are much higher in urban areas as can be observed, • Only agricultrual and elementary occupations are higher in rural
Next Steps • The Report released today will be distributed in print copies and online • Published census reports can be accessed online at: www.dop.gov.mm and http://myanmar.unfpa.org/census(all publications and tables in Microsoft excel) • Additional data to be requested by letter, email to Director General, Department of Population
Next Steps • In the coming months, 13 thematic reports will be release as soon as are ready • The topics addressed in these detailed reports are: Fertility and Nuptiality, Mortality, Maternal Mortality, Migration & Urbanization, Education, Disability, Population Projections, Housing, Children and Young People, Elderly, Labour Force, Gender and lastly Census Atlas
Labor force participation rate • Age-specific labor force participation rate
Unemployment rate Age specific unemployment rate