Earthquake Risk Modelling
Earthquake Risk Modelling. Dr. Dirk Hollnack GeoRisks Research Group Munich Reinsurance Company. Contents. 1. Principles of Risk Assessment 2. Hazard Maps 3. Earthquake Scenarios 4. Probabilistic Modelling 5. Insurance Aspects. Principles of Risk Assessment.

Earthquake Risk Modelling
E N D
Presentation Transcript
Earthquake Risk Modelling Dr. Dirk Hollnack GeoRisks Research Group Munich Reinsurance Company
Contents • 1. Principles of Risk Assessment • 2. Hazard Maps • 3. Earthquake Scenarios • 4. Probabilistic Modelling • 5. Insurance Aspects
Hazard= occurrence probability for event of a certain size Vulnerability ofbuildings, contents, BI Values, Liabilities Earthquake Risk and its Components Risk = f
Natural Catastrophe Modelling • Representation of natural phenomena (severity, location, probability) • Calculate the consequences of these phenomena • Risk management (preparedness, mitigation) • Estimate loss potentials Why do we use risk models?
Player in EQ Risk Modelling • EQ Risk Modelling is done by: • Consultants • (Re)Insurances • Brokers • Geol. surveys and public agencies • Scientific groups/universities ‘Insurance Business’ ‘Science’ and public
NatCat Risk Modelling for Insurance Business • Insurance business uses NatCat risk models since the 80th • Some examples: • AIR since 1987 • Munich Re since 1987 • RMS since 1988 • EQECAT since 1994 • Benfield since 1999
EQ Risk Modelling • Why are university risk models only used for a very limited extend in insurance business? • The methodology, resolution and parameters to be used vary with the purpose of risk modelling (i.e. mortality, disaster management, risk reduction, financial risk) • EQ models for insurances have a kind of standard which meets the requirements of the business. Research projects are often designed for a small area (i.e. one city), working on a high resolution and/or are focused on a detailed problem: • High computational requirements (run-time, memory) • Results are often difficult to adapt for insurance purposes
Exposure: What is a “Risk Element”? • Building • Contents • Machinery & equipment • Construction sites • Consequential loss (Business interruption, Advanced loss of profit) • Vehicles, Life, Arts, Social events (Olympic games, rock concerts), etc • => Much broader sense than in normally used in EQ Engineering
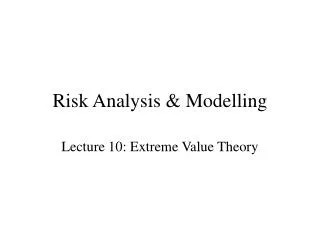
Insurance Aspects Average annual loss (AAL) => rating – site specificProbable maximum loss (PML) => catastrophe potential - regional scaleAn adequate Price and PML must reflect • Risk Location - Hazard • Type of Risk - Vulnerability • Insurance Conditions • (Claims Experience)
PML AAL
EQ Risk Models for Insurances • In Principle two different types of contracts which require different modelling methods: • Portfolio = large number of risks which are spatially distributed • Facultative = single risk (mainly large industry complexes or buildings)
single risk loss in [%] TSI portfolio return period Introduction to concepts of loss estimationSingle Risk vs. Portfolio
Insurance Conditions Self-participation • Deductibles • Limits
Hazard Maps Nathan- World Map of Natural Hazards (Maximum Intensity of a 475 years return period) No information about other return periods
Hazard Map/ Usage Basis of building codes/regulations Basis of tariff zones Warning signal Loss potential estimation Comparison of two locations
Hazard map/ problems Affected region not clear Verification difficult No regional differences inside hazard zones Secondary effects not included Only for one return period
Scenario What loss potentials can hit me in the case of a natural catastrophe?
Scenario Selection of scenarios Historical Modified historical Theoretical possible (virtual)
Scenarios/ use As/if calculations Comparison to market loss estimates Verification of probabilistic models Loss potential estimate/ budgets
Scenario / limitations Is my Scenario ... realistic ? adequate ? out-dated ? a support in determining the premium level ?
Probabilistic modelling • What are the loss potentials I have to expect for my portfolio? • How frequent do these losses occur?
Introduction to concepts of loss estimationProbabilistic modelling Principle: • Generation of large synthetic event sets (thousands to hundreds of thousands) • Assignment of occurence probabilities • Calculation of losses • Calculation of exceedence probabilities • Calculation of PML curve and technical rate
Probabilistic modelling • Event simulation is based on: • Measured events • Historic/ pre-historic events • Regional characteristics • Physical framework
Hazardinformation Scientific input Set ofscenarios Risk curve Expected loss/ lossoccurrenceprobability Munich Re's loss experience Vulnerability function Statistics The holistic Solution for Risk Assessment: Risk Models Value distribution Individual exposure
Detailed Risk Information • Risk models require high resolution data: • (GPS) coordinates • Geotechnical information • Building characteristics • Age • Height • Occupancy • Construction type
CRESTA – An Insurance Standard CRESTA was set up by the insurance industry in 1977 as an independent organisation for the technical management of natural hazard coverage. CRESTA's main tasks are: • Determining country-specific zones for the uniform and detailed reporting of accumulation risk data relating to natural hazards and creating corresponding zonal maps for each country • Drawing up standardised accumulation risk-recording forms for each country • Working out a uniform format for the processing and electronic transfer of accumulation risk data between insurance and reinsurance companies
The CRESTA Format Greece – 16 Zones Germany – 8270 Zones
Uncertainties in Risk Modelling • Event (location, size) • Intensity (attenuation, directivity) • Local influence (amplification, frequency) • Risk information (building quality, location) • Vulnerability (average damage, distribution) • Loss (estimation of values, demand surge)
Uncertainties in Risk Modelling • There is a general tendency in modelling to increase the resolution and the number of parameters: • Does this really increase the quality of the models?
Information required Exercise 1:Estimation of Insurance Rate – Single Risk • Location of the risk • Intensity levels for various return periods • Type and quality of the risk to estimate the vulnerability • Value of the risk • Insurance conditions applied
Estimation of Insurance Rate • sum of premiums = sum of loss(over a certain time)(over a certain time)
Estimation of Insurance Rate • sum of premiums = sum of loss(over a certain time)(over a certain time)
Hazard Maps As a rule of Thumb (only for earthquakes): If the return period for one Intensity is known, a factor of 3-4 can be used to assess the return period for other Intensities
Rate Calculation • Rate (%) = 1/Return Period(1) * Loss%(1) + 1/Return Period(2) * Loss%(2) ... + 1/Return Period(n) * Loss%(n)
Information required Exercise 2Estimation of Scenario Losses • Geographical distribution of the liabilities(Accumulation assessment zones) • Risk classes (residential, commercial, industrial) • Insured interests (building, contents, lop) • Intensity field of the EQ-scenario • Vulnerabilities • Values • Deductibles applied
4 5 2 Capital 3 1 6 7 8 10 9 Accumulation assessment zones Example • Definition of zones by either geographical regions or provinces or districts or postal codes