Density Curves and Normal Distribution
280 likes | 519 Vues
This resource delves into the concepts of density curves and normal distribution, highlighting their significance in statistics. It emphasizes the importance of organized note-taking, active participation, and model utilization for understanding data distributions. The material showcases the regular patterns in large datasets through smooth curves and introduces the fundamental properties of density curves, including mean and median. A detailed explanation of the 68-95-99.7 rule is provided, along with practical examples and exercises to enhance comprehension of statistical principles.

Density Curves and Normal Distribution
E N D
Presentation Transcript
DensityCurves andNormal Distribution Mr. Markwalter
Notagoras’ Theorem • People who keep organized notebooks are doing the best • People who copy down my examples are doing the best • People who ask questions are doing the best • ∴Take our a notebook. No more loose leaf • I will start putting up models for note-taking
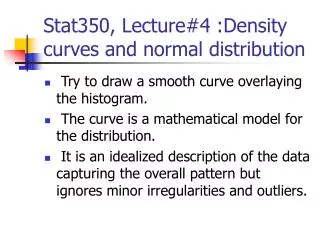
So… • We can make histograms of data. • But sometimes we have a lot of data and: THE OVERALL PATTERN OF A LARGE NUMBER OF OBSERVATIONS IS SO REGULAR WE CAN DESCRIBE IT BY A SMOOT CURVE!
Let’s See What I Mean • 947 students tested • Distribution of scores is below
Let’s See What I Mean • We can look at it in the raw numbers OR • We can fit a curve (in red) that is a good model
Let’s See What I Mean • If we shade all the scores less than 6, what percentage of scores do you think we shaded?
Let’s See What I Mean • 30.3% or 287 people out of 947 • That means the total area of the bars would be 100% or a proportion of 1! 30.3%
Let’s See What I Mean • If we want to talk about the red curve, we make the total area below the curve 1. 30.3%
Let’s See What I Mean • The area below the curve less than 6 is 0.293. • That is 29.3% of the area which is less than 6. 30.3%
Let’s See What I Mean • The curve is a pretty good model for the bars! 30.3% 29.3%
Density Curve • Is always on or above the horizontal axis • Has an area of 1 underneath it • A density curve describes the overall pattern of distribution. • The area under the curve and above any interval is the proportion of observations that fall in that interval.
Mean and Median Density Curves • Mean is the balancing point of the curve • Median is the marker of equal areas; divides the area under the curve in half.
Test • If the area to the left line in the density curve shown below is 0.40, what is the area of the other part? 0.40
Test • What percentage of observations are to the left of the line in the curve below? 0.40
Density Curves Are Sweet But… • There is one kind of curve that trumps them all. • We see it more than anything else • It is the basis of 95% of statistics.
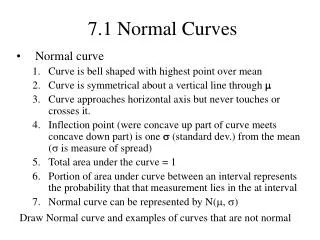
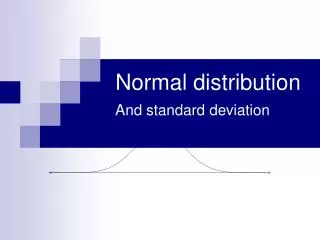
Normal Curves • Describe Normal Distributions • They are defined by two numbers • Mean: μ • Standard Deviation: σ (the average distance from the mean) • Bell Shaped
Normal Curves • They are defined by two numbers • Mean: μ • Standard Deviation: σ • Bell Shaped
Normal Curves • As usual, the area under the curve is 1 • Let’s take a look. • http://www-stat.stanford.edu/~naras/jsm/NormalDensity/NormalDensity.html
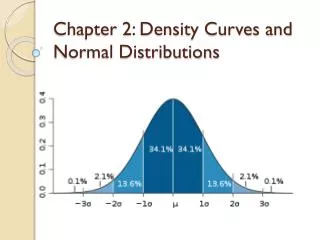
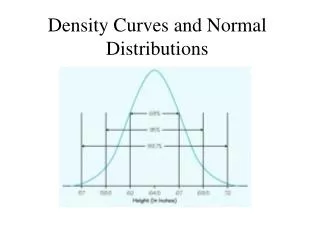
The 68-95-99.7 Rule • In the Normal distribution with mean μ and standard deviation σ: About 68% of observations fall within σ of μ. About 95% of observations fall within 2σof μ. About 99.7% of observations fall within 3σof μ.
Almost Done • Usually we define a Normal curve like this • N(μ, σ) • N(6, 1) means we have a curve with mean 6 and standard deviation 1. • Using our 68-95-99.7 Rule… 6-1=5 and 6+1=7 68% of the observations are between 5 and 7.
Practice • I make candies. The mean mass of the candy is 100g and the standard deviation is 5. • Draw a Normal curve for the situation. • What percentage of candies is between 95g and 105g? • What percentage of candies is less than 105g?
Practice • I make throw frisbees. My mean throw is 75 yards with a standard deviation of 5 yards • Draw a Normal curve for the situation. • What percentage of throws is between 65 and 85 yards? • What percentage of throws is less than above 70 yards?
Your Turn • Spend 15 minutes doing this worksheet. • You may work with those around you. • If you do not finish it is homework.
Standard Deviation Practice? • 1, 4, 5, 5, 6, 9 • Find the standard deviation