
Analysis of L2 and L3 Image Intensity Data: Methodology and Results Overview
E N D
Presentation Transcript
methods • Define here all terms used on AXIs labels
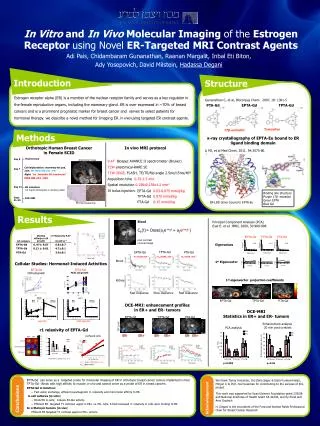
Frames of L2 intensity consecutive imagesfrs 1-9, 1/30 sec.. Redo using every other frame ..larger, no grid..calib bars
Must include linear profile line to display method of next slide calib bar in microns
Pixel distance must be in microns Label these panels correctly
Substraction of L2 image..needs color bar for intensity ..calib bar for micron.. 5u x5u ROI used ..mean value obtained for each subtraction image
Equations here include on each plot average intensity vs avg velocity L2 data: linear correlation is shown
Results 1 • L2s avg Vprop in IZPCs vs NZPCs .. Different or same????(IZPC<NZPC??) • relation between L2 avg ratio and avg Vprop in each cell group is ???? • Positive correlation (m= , p>??) between ratio and vprop ???
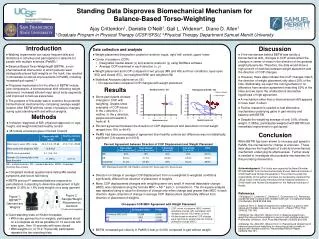
Consecutive Images of an L3 in IZPC time eachframe =2/30 sec Px size fr3 fr1 fr2 fr4 fr7 fr8 Pxel size(needs to be in microns …color bar not here,,intensity(not ratio)
Insert a panel here that shows how the L3s path in the previous slide
N=15 L3s Include avg values ? Intensity = 5ux 5u ROI
Results 2 • Avg Vprop of L3s is …at avg int of … • Relationship of L3 Vprop to L3 intensity???unrelated?? • Are the events of L3 part of a continum of the events of L2???