Download
1 / 1
10 likes | 128 Vues
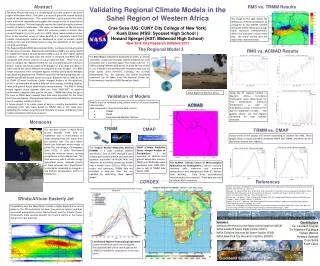
Abstract. RM3 vs. TRMM Results. Validating Regional Climate Models in the Sahel Region of Western Africa.

E N D
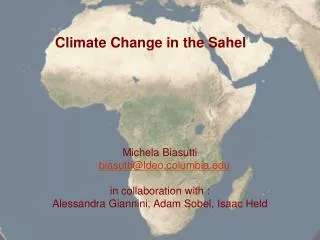
Abstract RM3 vs. TRMM Results Validating Regional Climate Models in the Sahel Region of Western Africa The West African Monsoon is a climatological moisture system in the Sahel region of Western Africa. The Sahel is an area of grassland located directly south of the Sahara Desert. The rainfall follows a cyclic pattern that shifts north and south seasonally and supplies the annual source of precipitation to these countries. The band typically reaches the Sahel during the summer months of June to September. The region is dependent on the monsoon season for its water needs. When the monsoon season is shorter than normal droughts can occur, such as in 2005, when severe problems arose. Due to the sensitive nature of Sahel Rainfall, it is absolutely crucial that reliable climatological models be developed in order to predict rainfall trends in the near and distant future so that the inhabitants of the region can plan accordingly. The Regional Model (RM3) developed at GISS is running and producing data for the area of interest. Regional Climate Models (RCM’s) are being tested to supplement Global Climate Models (GCM’s) due to their higher spatial resolution. Once the data from the model is retrieved, the RM3 will be compared with several sources of actual observed data. These tests are done to validate the regional models for use in predicting future trends in African rainfall and future patterns of drought so that steps are taken in order ensure the areas affected are prepared for the drought. The RM3 model simulations were compared against monthly precipitation averages calculated and graphed from TRMM (Tropical Rainfall Measuring Mission), a satellite specifically located above the tropics (between 50S to 50N) as well as CMAP (Climate Prediction Center Merged Analysis of Precipitation), which is an ensemble of various different data sources including satellite, radar, and ground based observational measurements. The RM3 is being tested against these regional data sets from 1989-2007 to confirm performance based on data used in the past. TRMM data does not go as far back as CMAP data, however their data were consistent for the times that they overlapped. Observational data are also available for comparison from 51 weather stations in Africa. A future project is to create maps of daily or monthly precipitation and comparing them with maps based on TRMM data in the same area. Validating the models using historical real data increases confidence in the model’s simulations of future scenarios. The image to the right shows the differences of RM3 precipitation as compared to the TRMM satellite data (JJAS 2006). Yellow and orange value represent overestimation, while blue and green values mean that the actual rainfall over the region was underestimated. Crae Sosa (UG: CUNY City College of New York) Kush Dave (HSS: Syosset High School ) Howard Spergel (HST: Midwood High School) New York City Research Initiative 2011 The Regional Model 3 RM3 vs. ACMAD Results The RM3 (Regional Model 3) developed at GISS is a climate simulation model that simulates rainfall, temperatures and circulation over a specified region. The model uses 0.5 ° (~ 50km) spacing between grid points. In order for the model to run, it needs to be provided with boundary data such as wind speed, wind direction, humidity, sea surface temperatures, etc. For example, the lateral boundary conditions can be taken from The National Center for Environmental Prediction (NCEP Reanalysis Data). Sahel Region of Western Africa Using the 51 stations located in Western Africa, Correlation Coefficients were determined for max temperature, minimum temperature, as well as Precipitation across 3 months from April to September of 2011. The graphs shown are the highest correlated for each variable retrieved. Validation of Models • Models must be validated using several sources of actual observed historical data. • RM3 compared to three historical data sources: • TRMM • CMAP • Ground Based Weather Stations ACMAD Monsoons TRMM CMAP TRMM vs. CMAP The monsoon season in West Africa occurs annually from June to September and is characterized by winds blowing from the ocean onto the Sahelian belt. The area where North and Southeast winds merge is called the Intertropical Convergence Zone (ITCZ). It shifts Northward during the monsoon season, causing precipitation in the Sahelian belt. The local economy, which includes a large agricultural sector, depends greatly on these seasonal rains. Precipitation is also highly correlated to changed in Sea Surface Temperatures (SST’s) in the Atlantic. Future parts of the project will involve continuing to validate the RM3. These graphs show a strong correlation between CMAP and TRMM., therefore we can use either data set for validation. CMAP (Climate Prediction Center Merged Analysis of Precipitation.) is an ensemble of Satellite and ground based data sources. CMAP and TRMM data were compared from 1998-2007, due to lack of TRMM data before 1998. The Tropical Rainfall Measuring Mission (TRMM) is a polar orbiting satellite launched in June of 1997 through a joint collaboration between NASA and JAXA (the Japanese equivalent of NASA) with the objective of accurately measuring rainfall over a domain from -50ºS to 50ºN in the tropics and subtropics. TRMM data are recorded in near-real time, but are updated by calibrating them against gauges. The ACMAD (African Centre of Meteorological Applications for Development ). We are currently receiving daily maximum and minimum temperatures and precipitation from 51 stations from ACMAD. Data from observational measurements are compared. These data are used to validate RM3 smulations. CORDEX References Druyan, Leonard M.., and Matthew Fulakeza. Regional Climate model applications for West Africa and the tropical eastern Atlantic. New York NY: n.p., 2011. Print. Nasa.gov. Ed. Steve Kempler. N.p., 13 July 2011. Web. 26 July 2011. <http://disc2.nascom.nasa.gov///_V6.3B43.2.shtml>. NCEP-DEO AMIP-II Reanalysis (R-2): M. Kanamitsu, W. Ebisuzaki, J. Woollen, S-K Yang, J.J. Hnilo, M. Fiorino, and G. L. Potter. 1631-1643, Nov 2002, Bul. of the Atmos. Met. Soc. Kummerow C., W. Barnes, T. Kozu, J. Shiue and J. Simpson, 1998. The Tropical Rainfall Measuring Mission (TRMM) sensor Package. J. Atmos. Oceanic Technol., 15, 809-816. Legates, D. R. and C. J. Willmott, 1990. Mean seasonal and spatial variability in gauge-corrected, global precipitation. International Journal of Climatology, 10, 111-127 Jones, Colin, and GrigoryNikulin. Evaluating the First Cordex Simulations over Africa. SMHI. N.p., 4 June 2010. Web. 26 July 2011 <http://www.smhi.se/forskning/forskningsomraden/klimatforskning/1.11299>. Winds/African Easterly Jet Precipitation over the West African climate is highly dependent on wind patterns. The African Easterly Jet steers low pressure systems and their associated precipitation across the continent and the Atlantic Ocean. Occasionally these systems develop into tropical storms or hurricanes that arrive in the Americas. Sponsors: National Aeronautics and Space Administration (NASA) NASA Goddard Space Flight Center (GSFC) NASA Goddard Institute for Space Studies (GISS) NASA New York City Research Initiative (NYCRI) Contributors Dr. Leonard Druyan Dr. Matthew Fulakeza Ruben Worrell Howard Spergel Crae Sosa Kush Dave Coordinated Regional Downscaling Experiment Several models evaluated over six regions The validated RM3 will be contributed to the CORDEX ensemble for comparison, in the near future.