Current Research Applications of Flow Cytometry and Cell
410 likes | 630 Vues
Current Research Applications of Flow Cytometry and Cell. J.Paul Robinson Professor of Immunopharmacology Professor of Biomedical Engineering Purdue University Email: jpr@flowcyt.cyto.purdue.edu WEB: http://www.cyto.purdue.edu. Faculty Lecture at Kitasato University, Towada, Japan

Current Research Applications of Flow Cytometry and Cell
E N D
Presentation Transcript
Current Research Applications of Flow Cytometry and Cell J.Paul Robinson Professor of Immunopharmacology Professor of Biomedical Engineering Purdue University Email: jpr@flowcyt.cyto.purdue.edu WEB: http://www.cyto.purdue.edu Faculty Lecture at Kitasato University, Towada, Japan June 26-July 4, 2000
Lecture summary This lecture will discuss the principles of flow cytometry and how they are applied to basic research and clinical questions. We will discuss the general principles of how a flow cytometry operates and why this technology has advantages over many others. In addition, we will look as some examples of newer applications such as apoptosis, multiplexed bead assays and future applications. Cell sorting using your recently acquired Coulter Altra will be described and the key features discussed.
Purdue University Cancer Center&Purdue University Cytometry Laboratories
What can Flow Cytometry Do? • Enumerate particles in suspension • Determine “biologicals” from “non-biologicals” • Separate “live” from “dead” particles • Evaluate 105 to 106 particles in less than 1 min • Measure particle-scatter as well as innate fluorescent • Measure 2o fluorescence • Sort single particles for subsequent analysis
Introductory Terms and Concepts • Parameter/Variable • Light Scatter- Forward (FALS), narrow (FS) • - Side, Wide, 90 deg, orthogonal • Fluorescence - Spectral range • Absorption - loss of light • Time - Kinetics • Count - number of events/particles/cells
Concepts • Scatter: Size, shape, granularity, polarized scatter (birefringence) • Fluorescence: • Intrinsic: Endogenous pyridines and flavins • Extrinsic: All other fluorescence profiles • Absorption: Loss of light (blocked) • Time: Useful for kinetics, QC • Count: # events -always part of any collection
Instrument Components Electronics: Control, pulse collection, pulse analysis, triggering, time delay, data display, gating, sort control, light and detector control Optics: Light source(s), detectors, spectral separation Fluidics: Specimen, sorting, rate of data collection Data Analysis: Data display & analysis, multivariate/simultaneous solutions, identification of sort populations, quantitation
Arc Lamp Excitation Spectra Xe Lamp Irradiance at 0.5 m (mW m-2 nm-1) Hg Lamp Shapiro p 99
Lasers • Argon laser • He-Ne Laser
Optical Collection systems 2nd Argon Laser He-Ne Laser Argon Laser He-Cd Laser
Elite Cytometer with 4 Lasers He-Cd laser Santa clause Air-cooled argon laser Water cooled argon laser
Optical Design PMT 5 PMT 4 Sample PMT 3 Dichroic Filters Flow cell PMT 2 Scatter PMT 1 Laser Sensor Bandpass Filters
Coulter Optical System – Elite/Altra PMT2 PMT1 PMT4 PMT3 • The Elite optical system uses 5 side window PMTs and a number of filter slots into which any filter can be inserted 555 - 595 575 BP 525 BP 488 BP PMT5 L L L D D D 632 BP 675 BP 488 BK 0 5 5 9 2 5 4 6 0 655 - 695 APC PMT6 TM PMT7 Purdue Cytometry Labs PUCL3034
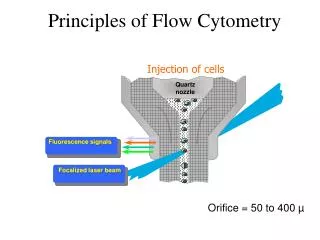
Sample in Sheath Figure 1 The central component of a flow cytometer is the flow cell. A cutdown of a typical flow cell indicates the salient features. Sample is introduced via the sample insertion rod. Sheath fluid (usually water or saline) is ntroduced to surround the insertion rod causing hydrodynamic focussing of flowing cells which are contained within a core fluid. The laser intersects the fluid either outside the flowcell (in air) or in a slightly extruded portion of the flow cell tip (in quartz). Stream Charge Piezoelectric crystal oscillator Sheath in Sensors SORT DECISIONS Sensor Laser beam SMALL BEAD LARGE BEAD SORT RIGHT SORT LEFT Last attached droplet Frequency Histogram -4KV +4KV Signals are collected from several sensors placed forward or at 90° to the laser beam. It is possible to “sort” individual particles. The flow cell is resonated at a frequency of approximately 32KHZ by the piezoelectric crystal mounted on the flow cell. This causes the flowing stream to break up into individual droplets. Gating characteristics can be determined from histograms (shown right) and these can be used to define the sort criteria. These decisions are all controlled by the computer system and can be made at rates of several thousand per second. RIGHT LEFT Waste SMALL BEAD LARGE BEAD
Fluorescence • The wavelength of absorption is related to the size of the chromophores • Smaller chromophores, higher energy (shorter wavelength)
Fluorescence • Stokes Shift • is the energy difference between the lowest energy peak of absorbance and the highest energy of emission Stokes Shift is 25 nm Fluorescein molecule 520 nm 495 nm Fluorescnece Intensity Wavelength
350 457 488 514 610 632 300 nm 400 nm 500 nm 600 nm 700 nm Common Laser Lines PE-TR Conj. Texas Red PI Ethidium PE FITC cis-Parinaric acid
Fluorescence Resonance Energy Transfer Molecule 1 Molecule 2 Fluorescence Fluorescence ACCEPTOR DONOR Intensity Absorbance Absorbance Wavelength
Flow cytometry measurements SCATTER FLUORESCENCE IMAGE G M L
Data Presentation Formats • Histogram • Dot plot • Contour plot • 3D plots • Dot plot with projection • Overviews (multiple histograms)
Data Analysis Concepts • Gating • Single parameter • Dual parameter • Multiple parameter • Back Gating • Note: these terms are introduced here, but will be discussed in more detail in later lectures
CD45 Tube ID Mo1 CD8 CD4 FITC Fluorescence CD8 leu11a CD20 Data Representation
The Cell Cycle M G2 G1 Quiescent cells G0 S
A DNA histogram G0-G1 Cell Number G2-M S Fluorescence Intensity
A typical DNA Histogram G0-G1 G2-M S # of Events Fluorescence Intensity
Reticulocyte Analysis RMI = 34 RMI = 0 1000 100 .1 1 1000 1 10 10 100 .1 log Thiazole Orange log Thiazole Orange
Labeling Strand Breaks with dUTP [Fluorescein-deoxyuridine triphosphate (dUTP)] Green: apoptotic cells R2: Apoptotic Cells Green Fluorescence Side Scatter R1: Normal Cells Red: normal cells PI-Red Fluorescence Forward Scatter Green Fluorescence Green Fluorescence is Tdt and biotin-dUTP followed by fluorescein-streptavidin Red fluorescence is DNA counter-stained with 20µg/ml PI
Neutrophils Lymphocytes Monocytes Scatter Pattern of Human leukocytes A flow cytometry scattergram Forward scatter (size) Side scatter (granularity)
Three Color Lymphocyte Patterns CD4 CD4 CD3 CD8 CD8 CD3 Data from Dr. Carleton Stewart
mixture Run on Coulter XL cytometer mixture Scatter BG BG E.coli E.coli Scatter Fluorescence YoYo-1 stained mixture of 70% ethanol fixed E.coli cells and B.subtilis(BG) spores.
Live cell/dead cell PI Fluorescence PI Hoechst 33342 Data from Dr. Doug Redelman, Sierra Cytometry
Oxidative Reactions • Superoxide Hydroethidine • Hydrogen Peroxide Dichlorofluorescein • Glutathione levels Monobromobimane • Nitric Oxide Dichlorofluorescein
Calcium Flux Flow Cytometry Image Cytometry 0.8 0.7 0.6 0.5 0.4 Ratio: intensity of 460nm / 405nm signals 0.3 0.2 Stimulation 0.1 Time (seconds) 108 0 36 72 144 180 Time (Seconds) 0 0 50 100 150 200
Repolarized Cells fMLP Added PMA Added Green Fluorescence 0 512 1024 0 512 1024 Green Fluorescence Depolarized Cells 0 1200 2400 0 150 300 Time (sec) Time (sec) Membrane Potential • Cyanine Probes • How the assay works: • Carbocyanine dyes released into the surrounding media as cells depolarize • Because flow cytometers measure the internal cell fluorescence, the kinetic changes can be recorded as the re-distribution occurs • Oxonol Probes
Summary Main Applications • DNA and RNA analysis • Phenotyping • Cell Function • Sorting and cell isolation • Immunological assays
Coulter Altra The facilities at Kitasato University
Coulter XL Cytometer The facilities at Kitasato University