Clinical Applications of Flow Cytometry
710 likes | 1.4k Vues
Clinical Applications of Flow Cytometry. J.Paul Robinson Professor of Immunopharmacology Professor of Biomedical Engineering Purdue University School of Veterinary Medicine. Primary areas. DNA/RNA Analysis Microbiology Phenotyping Cell Function.

Clinical Applications of Flow Cytometry
E N D
Presentation Transcript
Clinical Applications of Flow Cytometry J.Paul Robinson Professor of Immunopharmacology Professor of Biomedical Engineering Purdue University School of Veterinary Medicine
Primary areas • DNA/RNA Analysis • Microbiology • Phenotyping • Cell Function
Purdue University Cancer Center&Purdue University Cytometry Laboratories
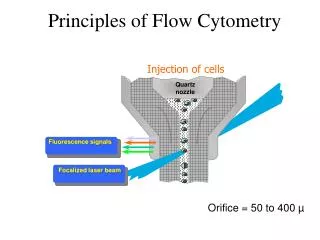
Brief Introduction to Flow Cytometry • What do these instruments look like? • What does flow cytometry do? • How does it work? • Why is it useful?
Optical Design PMT 5 PMT 4 Sample PMT 3 Dichroic Filters Flow cell PMT 2 Scatter PMT 1 Laser Sensor Bandpass Filters
A Histogram(a frequency distribution graph) # of Events Increase in Fluorescence Intensity
DNA Probes • DNA in cells can be stained with a fluorescent dye • DNA probes like Propidium Iodide are STOICHIOMETRIC – that means the number of molecules of probe bound is equivalent to number of molecules of DNA • So we can measure how much DNA is in a cell
DNA/RNA Probes • Propidium Iodide • Hoechst • Cyanine Dyes • TOTO-1 , YOYO-1, TOTO-3 • Thiazole Orange, Thiazole Blue, Thioflavin • PRO dyes • SYTO/SYTOX dyes (Sytox green) • Acridine Orange • Pyronin Y • Styryl Dyes • Mithramycin + EtBr
The Cell Cycle M G2 G1 Quiescent cells G0 S
Definitions & Terms • Ploidy • related to the number of chromosomes in a cell • Haploid: Number of chromosomes in a gamete (germ cell) is called the HAPLOID number for that particular species • Diploid: The number of cells in a somatic cell for a particular species
Definitions & Terms • Hyperdiploid: greater than the normal 2n number of chromosomes • Hypodiploid: Less than the normal 2n number of chromosomes • DNA Tetraploidy: Containing double the number of chromosomes
Definitions & Terms • DNA Index: The ratio between the mode of the relative DNA content of the test cells (in G0/G1phase) to the mode of the relative DNA content in normal G0/G1 diploid cells • Coefficient of Variation - CV: The ratio between the SD of the mode of the G0/G1 cell populations expressed as a percentage.
A DNA histogram G0-G1 Cell Number G2-M S Fluorescence Intensity
A typical DNA Histogram G0-G1 G2-M S # of Events Fluorescence Intensity
Multiparameter gating R1-gate Cyclin - B1 - FITC Mitotic cells P-105 Cy5 Endoduplicating population DNA - Hoechst DNA - Hoechst Human Prostate tumor cell line DU-145 Data from Dr. James Jacobberger
DNAAnalysis 0 200 400 600 800 1000 4N 2N PI Fluorescence DNA Analysis Aneuploid peak 0 200 400 600 800 1000 PI Fluorescence
Reticulocyte Analysis RMI = 34 RMI = 0 1000 100 .1 1 1000 1 10 10 100 .1 log Thiazole Orange log Thiazole Orange
RMI = 34 R3 R1 R4 R2 1000 100 .1 1 10 log Thiazole Orange Reticulocyte Analysis
Measurement of Apoptosis • Apoptosis is programmed cell death where the cell goes through a highly regulated process of “dying”. • Characteristics are condensation of the chromatin material • Blebbing of nuclear material • Often accompanied by internucleosomal degradation of DNA giving rise to distinctive 'ladder' pattern on DNA gel electrophoresis.
Detection Methods for Apoptotis • Phosphatidyl serine, can be detetected by incubating the cells with fluorescein-labeled Annexin V • By staining with the dye, Hoechst 33342 (UV) • By staining with the dye PI (visible) • By staining with the dye YOPRO-1 (visible)
Apoptotic cells Normal G0/G1 cells # Events PI - Fluorescence Flow Cytometry of Apoptotic Cells
Labeling Strand Breaks with dUTP [Fluorescein-deoxyuridine triphosphate (dUTP)] Green: apoptotic cells R2: Apoptotic Cells Green Fluorescence Side Scatter R1: Normal Cells Red: normal cells PI-Red Fluorescence Forward Scatter Green Fluorescence Green Fluorescence is Tdt and biotin-dUTP followed by fluorescein-streptavidin Red fluorescence is DNA counter-stained with 20µg/ml PI
Nuclear Antigens • Ki-67 - proliferation related antigen • Ki-S1 - proliferation related antigen • Cyclin A: expression begins in late G1/early S phase and increases as cells traverse S phase, reaching a maximum in G2. Cyclin A is not expressed in mitotic cells • Cyclin B1: accumulates in late S phase but is maximally expressed in G2 and mitosis.
Nuclear antigens DNA - Hoechst Cyclin - B1 - FITC (log) P-105 -CY5 FALS 90 deg Scatter (log) Cyclin - B1 - FITC Human Prostate tumor cell line DU-145 Data from Dr. James Jacobberger
Differential Inflammatory Cell Count Data from Dr. Doug Redelman, Sierra Cytometry
PI only binds to DNA where it can gain access to the cell - ie Dead cells Hoechst binds to all DNA - It is UV excited Simultaneous UV & Visible Light PI - fluorescence Hoechst 33342 (UV) Hoechst Data from Dr. Doug Redelman, Sierra Cytometry
Hoechst & PI Fluorescence PI Hoechst 33342 Data from Dr. Doug Redelman, Sierra Cytometry
Hoechst/PI Boar Sperm FL2-PI Dead FL1-Hoechst Data from Dr. Doug Redelman, Sierra Cytometry
Human Sperm Sybr green PI Data from Dr. Doug Redelman, Sierra Cytometry
Human Sperm - PI - Sybr-Green I PI Sybr-Green live inactive active dead Data from Dr. Doug Redelman, Sierra Cytometry
Microbiology • Detection of unknown organisms • Antibiotic sensitivity testing • Detection of Spores
Uptake of rhodamine 123 by M.luteus M.luteus Changes in light scattering behaviour and in the ability to accumulate Rhodamine 123 during resuscitation of a starved cultured of M. luteus. Cells were starved for 2.5 months, incubated with penicillin G for 10 hours, washed, and resuscitated in weak nutrient broth. Data represent a culture (A) immediately after the penicillin treatment, and (B) 2 days later. Data from Dr. Hazel Davey
Mixed suspensions of bacteria Identification on scatter alone? BG E.coli BG doublets Count doublets ? log SS debris BG spores E.coli cells debris log FS log FS Light scatter signature of a mixture of B.subtilis spores (BG) and E.coli cells.
Light Scatter of Bacterial Spores B.anthracis SS B.subtilis irradiated B.anthracis FS Light scatter signals from a mixture of live B.anthracis spores, live B. subtilisspores and gamma irradiated B. anthracisspores.
Nucleic Acid Content • Distinguish bacteria from particles of similar size • by their nucleic acid content • Fluorescent dyes • -must be relatively specific for nucleic acids • -must be fluorescent only when bound to • nucleic acids • Examples • DAPI • Hoechst 33342 • cyanine dyes YoYo-1, YoPro-1, ToTo-1
mixture Run on Coulter XL cytometer mixture Scatter BG BG E.coli E.coli Scatter Fluorescence YoYo-1 stained mixture of 70% ethanol fixed E.coli cells and B.subtilis(BG) spores.
Microbial Identification Using Antibodies • Enumeration & identification of target organisms in • mixed populations • Examples include: • Legionella spp. in water cooling towers • Cryptosporidium & Giardia in water reservoirs • Listeria monocytogenes in milk • E.coli O157:H7 in contaminated meat • Bacillus anthracis& Yersinia pestisbiowarfare agents
Phenotyping - Immunophenotyping • Characterization of white blood cells • Identification of lymphocyte subsets
CELLULAR ANTIGENS cytokines structure enzymes Adhesion Receptors Metabolic T cells B Cells courtesy of Jim Bender
Immunofluorescence staining specific binding nonspecific binding Data from Dr. Carleton Stewart
Direct staining • Fluorescent probe attached to antibody • Specific signal: weak, 3dyes/site • Nonspecific binding: low Data from Dr. Carleton Stewart
Indirect staining • Fluorescent probe attached to a 2nd antibody • Specific signal: strong, 5-6 2nd Ab/each 1st Ab; therefore 15-18 dyes/site • Nonspecific binding: high Data from Dr. Carleton Stewart
Avidin-Biotin method I biotinylated primary Ab biotin avidin biotinylated dye
Three Color Lymphocyte Patterns CD4 CD4 CD3 CD8 CD8 CD3 Data from Dr. Carleton Stewart
FOUR COLOR PATTERN CD56 CD8 CD4 CD3 CD3 CD3 CD8 CD4 CD4 CD56 CD56 CD8 Data from Dr. Carleton Stewart
From Duque et al, Clin.Immunol.News. PRE-BV PRE-BIV Negative Positive Mu PRE-BIII PRE-BII CD20 AUL PRE-BI CD10 TdT AMLL AML ? AML-M3 CD19 B,T CD13,33 T-ALL CD13,33 T HLA-DR Decision Tree in Acute Leukemia
Cellular Function • Phagocytosis • Killing index of phagocytes • Intracellular cytokines • Calcium flux • Oxidative burst • Membrane potential