Exploring Data Visualization Methods in Math Lessons
Learn about frequency tables, line plots, and histograms to represent data in math class with practical examples and quizzes.

Exploring Data Visualization Methods in Math Lessons
E N D
Presentation Transcript
Reporting Frequency LESSON 11-1 Problem of the Day Mari can package 14 seashells in a box. If she has 360 seashells, how many full boxes does she have? How many shells are left over after the boxes are filled? 25; 10 11-1
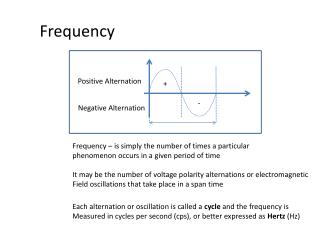
Reporting Frequency LESSON 11-1 What we’ll study today • Frequency table • Line plot • Histogram • These are all ways to show often something occurs. 11-1
Reporting Frequency LESSON 11-1 • A frequency table lists each item in a data set. 11-1
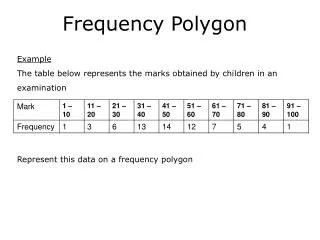
Age 5 6 7 8 9 10 11 12 13 Tally Frequency Reporting Frequency LESSON 11-1 Additional Examples – Frequency table The numbers below represent the ages of the students in a karate class. Make a frequency table of the data. 11 5 9 13 8 9 9 11 10 8 6 7 12 11 13 12 7 6 11 12 10 8 1 2 2 3 3 2 4 3 2 Which method of describing data is easily seen in a frequency table? 11-1
Reporting Frequency LESSON 11-1 • A line plot shows the shape of the data • Data is on a number line (stacks of Xs show frequency) • Best for a small number of data values • Xs must be spaced evenly 11-1
Write an x for each student above the age of that student. Draw a number line from the least to the greatest data item. Reporting Frequency LESSON 11-1 Additional Examples – Line plot Make a line plot of the data in Example 1. 11 5 9 13 8 9 9 11 10 8 6 7 12 11 13 12 7 6 11 12 10 8 • Best for a small number of data values (Why?) • Xs must be spaced evenly (Why?) 11-1
Reporting Frequency LESSON 11-1 • A histogram also shows the shape of data. • bar graph (no spaces between the bars) • equally sized intervals with no overlap 11-1
Hours Tally Hours Tally 1 11 2 12 3 13 4 14 5 15 6 16 7 17 8 18 9 19 10 20 Add a title. Label each axis. Label each axis. Reporting Frequency LESSON 11-1 Additional Examples - Histogram Make a histogram of the data below. Hours Spent on the Internet 11-1
Reporting Frequency LESSON 11-1 (For help, go to Lesson 1-6.) • For histograms: • Title • Decide the intervals (evenly spaced, no overlap) • Labeled axes • X-axis – intervals • Y-axis – frequency (always) • Make bars of equal width • Use a ruler! 11-1
Students 23 24 25 3 4 2 Class Reporting Frequency LESSON 11-1 Lesson Quiz 1. Make a frequency table and a line plot for the number of students in each class: 25 24 25 23 24 23 24 24 23. 11-1
What is this called? Hours 0–5 6–10 11–15 16–20 21–25 Frequency 3 5 10 24 15 Reporting Frequency LESSON 11-1 Lesson Quiz 2. The data table below shows how many hours of TV different people watch each week. Make a histogram of the data. How else can you display this data? 11-1
Reporting Frequency LESSON 11-1 Closure What is a frequency table? What do histograms and line plots have in common? What do frequency tables, histograms, and line plots have in common? 11-1
Reporting Frequency LESSON 11-1 Homework • Homework for Monday: • Lesson 11-1 p. 534 - 536: # 5, 7, 9, 12-16 all • Test on Chapter 3 11-1