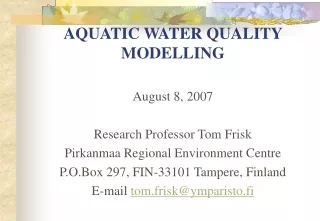
AQUATIC WATER QUALITY MODELLING
400 likes | 554 Vues
Water quality models help describe the connection between water status and affecting factors. They are essential for impact assessment and predicting scenarios to assess various factors simultaneously.

AQUATIC WATER QUALITY MODELLING
E N D
Presentation Transcript
AQUATIC WATER QUALITY MODELLING August 8, 2007 Research Professor Tom Frisk Pirkanmaa Regional Environment Centre P.O.Box 297, FIN-33101 Tampere, Finland E-mail tom.frisk@ymparisto.fi Phone +358 500 739 991
CONTENTS • 1. GENERAL • 2. MASS BALANCE MODELS FOR LAKES • 3. RIVER MODELS • 4. BIOLOGICAL AND CHEMICAL PROCESSES, PART I • 5. BIOLOGICAL AND CHEMICAL PROCESSES, PART II
1. GENERAL 1.1 General Concepts Water quality models are mathematical descriptions by means of which the connection between the status of water and the factors affecting it can be described. Water quality models are needed in practical impact assessment. On the basis of measurements we can only find out the Prevailing status of waters or to monitor changes occurring in the status. However, measurements are not sufficient when we need predictions with different scenarios of development or quantitative impact assessments in situations in which there are several factors affecting simultaneously.
In water quality models, the status of the water body is defined by means of state variables. In models such state variables are e.g. concentrations of the different substances, biomasses of the different groups of biota etc. Variables affecting the status of the water ecosystem (which themselves are not as state variables in the models) are called driving variables or forcing functions. The coefficients and other constants of the model are called parameters.
Models are always simplifications of reality. In them, the features of the aquatic ecosystem which are relevant from the point of view of the problem in question are described. A process in which the parameters of the model are adjusted so that the model calculates accurately enough the corresponding observed values is called calibration. If the calibrated model is applied using a new, independent Input data and the model calculates the observed values accurately enough the model can be considered to be validated. Sometimes validation is called verification.
There is a great variety in the complexity and the structure of water quality models. One classification is division into statistical and mechanistic models. • One of the simplest statistical models is a linear regression • Equation between two variables: • y = a + b x (1.1) • where: y = a dependent variable x = an independent variable a and b = parameters characteristic to the regression in question (a = regression constant, b= regression coefficient)
In non-linear regression the equation has another form, e.g.: • y = c xd (1.2) • where: • c ja d = constant parameters. The regression equations presented above do not generally try to describe the mechanisms between natural phenomena or causal relationships. For this kind of purposes, mechanistic environmental models have been developed.
In mechanistic models, well known laws of physics and chemistry are applied to necessary extent. The mathematical descriptions of biological processes are not as well known and generally accepted as those of physical and chemical processes. Sometimes the descriptions of biological processes may be even rough oversimplifications. The descriptions are being developed for models utilizing general scientific knowledge, observational data and the observed statistical relationships between different variables. Mechanistic water quality models can be transport oriented or ecosystem oriented. With transport oriented modes, concentration distributions are calculated whereas in ecosystem oriented models, the main emphasis is on Description of biochemical and biological processes.
Mechanistic models can be classified in several ways, for example: How space is described - 0-dimensional models: no spatial variation • 1-dimensioinal models: variation in one dimension, • horizontal either vertical - 2-dimensional models: variation in two dimensions - 3-dimensional models: variation in three dimensions.
How time is considered • Dynamic models: the temporal variation of the state variables • is calculated. - Transient models: the transition between successive steady states is considered in the model. • Steady state models: the values of the state variables are • temporally constant. Mechanistic models are based on the kinetic principle, the stoichiometric principle and the law of conservation of mass.
The kinetic principle means that reaction rates are described as proportional to concentrations or their functions. According to the stoichiometric principle the substances react in constant ratios. The law of conservation of mass is taken into account in water and mass balance equations (Chapter 1.3 Water Bodies as Hydraulic Systems) Mechanistic water quality models are usually formed so that for each state variable a differential equation is written in which the different processes are mathematically described. The differential equations are usually solved numerically.
1.2 The Reaction Kinetics of the Models In the models, simple kinetic descriptions are applied, e.g. zero, first and second order kinetics and Michaelis- Menten kinetics. In zero order kinetics, the reaction rate is constant: dc --- = a (1.3) dt where: c = concentration (ML-3), t = time (T), a = constant (ML-3T-1)
If the constant a is = 0 the substance is called conservative. According to the first order kinetics the reaction rate is strictly proportional to the concentration: dc --- = k1 c (1.4) dt where: k1 = first order reaction rate coefficient (T-1)
According to the second order kinetics is proportional to the square of concentration or to the product of two concentrations: dc --- = k2 c2 (1.5) dt where: k2 = second order reaction rate coefficient(M-1 L3 T-1)
1.3 Water Bodies as Hydraulic Systems In water quality models, water bodies are usually described as as simple hydraulic systems as possible. The purpose of the modelling effort is decisive in the selection how detailed a hydraulic description is needed in the model. A water quality model can be divided into a hydraulic compartment and a water quality compartment. The hydraulic compartment consists of equations describing transportation, mixing and dilution of substances. The flow velocities and discharges needed in the model with a detailed hydraulic description are calculated with a specific current model, whereas in simple models a water balance equation is usually sufficient.
The simplest basic descriptions are CSTR (= continuously stirred tank reactor) and PFR (= plug flow reactor or piston flow reactor). The starting point in the hydraulic descriptions is the mass balances of the water bodies. The mass balance of a water body can be described by the following equation: dm ---- = I - O + S (1.6) dt where: m = the total mass of the substance considered (M) I = the input of the substance considered (M T-1)
O = the output of the substance considered with the outgoing flow (M T-1) S = the rate of change of the total amount of the substance considered due to internal processes (M T-1) Fig. 1.1. A schematic presentation of the CSTR system
CSTR is often used in the description of lakes. In CSTR hydraulics the water body is assumed to be completely mixed and homogenous. • The incoming substances are assumed to mix immediately • with no delay. The concentration in the out flowing water • is assumed to be the same as the concentration in the water • body and so the output can be calculated as follows: • O = Q c (1.7) • where: • O = output (M T-1) • Q = discharge (L3T-1) • c = average concentration in the lake (M L-3)
Let us assume that the volume of the basin is constant. Because the total amount of the substance considered is the product of volume and average concentration the mass balance equation can be written in the following form: dc V --- = I – Q c + S (1.8) dt where: V = volume of the water body (L3)
If a conservative substance (S = 0) is considered, the mass balance equation can be written in the form: dc V --- = I – Q c (1.9) dt With constant input and discharge the solution of Eq. (1.9) is with the initial condition c = c0 when t = 0, Q - ---- t c(t) = cI + (c0 – cI) e V (1.10) where: c(t) = concentration as a function of time (M L-3) cI =mixing concentration, i.e. the ratio of input and discharge = I/Q (M L-3)
Eq. (1.10) can be used in calculating the development of a conservative substance (e.g. marker) in a completely mixed basin. If the input is constant a steady state is achieved (according to the model only in the eternity) in which c = cI. If we assume that the substance considered has a first order loss reaction (e.g. sedimentation, decomposition) the mass balance equation is written in the following form: dc V --- = I – Q c – k c V (1.11) dt k = first order reaction rate coefficient (T-1)
With constant input and discharge and the initial condition c = c0 when t = 0 the following solution is obtained: Q -t(k +---) I I V c(t) = ---------- - (----------- - c0) e (1.12) Q + k V Q + k V At steady state which theoretically (according to Eq. 1.12) is gained after an eternally long time, the following solution is obtained is obtained by setting the left hand side derivative in Eq. (1.11) as zero: I c = ---------- (1.13) Q + k V
In the basic form CSTR is applicable to shallow lakes with no stratification, and when long term average value considerations to lakes with regular turnover periods (e.g. dimictic or monomictic lakes) However, CSTR hydraulics can be modified so that CSTR elements are combined in horizontal or/and directions. Then CSTR hydraulics can be in principle applied to all kind of water bodies, e.g. to stratified lakes and even to rivers.
Plug flow reactor (PFR) is almost totally opposite against CSTR. In PFR no mixing is assumed in the direction of flow but the substance is assumed to flow along with water (advection). In other directions the water is assumed to be homogenous. PFR is applicable mainly to rivers but it has also been successfully applied to elongated lakes, e.g. to describe long term average values. The reaction takes place at the same tame as the water flows (τ) and the basic equation can be written as follows: dc --- = Sc (1.14) dτ
where: τ = flow time or travel time (T) Sc = the effect of the biological and physico-chemical (non-hydraulic) processes on concentration (M L-3T-1) It is important to notify that in Eq. (1.14) the term Sc describes the effect internal processes on concentration whereas the term S in Eq. (1.7) describes the effect of the internal processes on the total mass of the substance considered. Thus in principle the following equation can be written: S Sc = --- (1.15) V
The flow time (travel time) can be defined as follows. Let us assume that a certain amount of water, “a plug”, the flow of which is then followed, goes through the starting point of the calculation at the moment t0. The flow time is then τ= t - t0 (1.16) where: τ = flow time (T) t = time (T) t0 = the starting time of the consideration (T)
Because t0 is constant we can write: dτ = dt (1.17) The average velocity of flow (u) can be defined as follows: dx u = ---- (1.18) dτ When a conservative substance is considered the basic equation can be written as follows: dc ----- = 0 (1.19) dτ
The practical meaning of Eq. (1.19) is that the concentration does not change along with flow. The concentration in the river only changes when a new plug coming to the starting point has another concentration. If the loss reaction (e.g. decay or sedimentation) obeys first order kinetics the basic equation has the following form: dc ---- = - k c (1.20) dτ
The solution of Eq. (1.19) with the initial condition c = c0 when τ = 0 is the following: -kτ c(τ) = c0 e (1.21) If the velocity of flow is the same at the different points of the river we can write: _ τ = x/u (1.22) The concentrations at the different sites can then be calculated as follows: _ -k x/u c(x) = c0 e (1.23)
PFR hydraulics can be modified so that additional discharge and input of the substance along with the river are taken into account. Then also dilution must be taken into account. The basic equation is written in the following form: dc SQ SI --- = Sc - ---- c + ---- (1.24) dτ Ax Ax where: SQ = additional discharge per unit length of the river (L2T-1) SI = additional input of the substance considered per unit length of the river (M L-1 T-1) Ax = cross-sectional area of the river (L2)
The variables SI and SQ have the following relationship: SI = cs SQ (1.25) cs = concentration in the incoming additional water (M L-3) The concentration distributions of conservative substances (Sc = 0) as well as substances obeying first order kinetics (Sc = -kc) can be easily solved on the basis of Eq. (1.24). CSTR and PFR descriptions are extreme cases. Often Longitudinal mixing is incomplete.
The simplest way to describe incomplete longitudinal mixing is to for a linear combination of CSTR and PFR. However, the most common way is to add a term describing dispersion to the PFR equation. In this case the result is advection-dispersion reactor (ADR) hydraulics (or advection- dispersion hydraulics). The linear combination is formed as follows: c = D cp + (1 - D) cc (1.26) where: cp = the concentration calculated by means of the PFR model (M L-3) cc = the concentration calculated by means of the CSTR model(M L-3) D =plug flow coefficient
D can have values varying from zero to one. When D = 0 the description is CSTR and when D = 1 the description PFR. Fig 1.2. The concentration distributions with three values of the plug flow coefficient D
In the ADR model the transport of substances is considered as two processes: transport with flow, i.e. advection and the impact of mixing, i.e. dispersion. Rivers are usually considered as one-dimensional systems whereas lakes or seas are considered as two- or three-dimensional systems. The idea of advection is that when water flows the dissolved (or suspended) substances flow along. Dispersion is contributed to by molecular and turbulent diffusion as well as (horizontal) differences in velocities of flow. The dispersion processes tend to smooth the concentration distributions. The requirement for dispersion is a concentration gradient.
A one-dimensional model describing one-dimensional longitudinal advection-dispersion equation can be derived by considering an ideal hydraulic element of the water body with the cross-sectional area of Ax and the length of dx. The effect of advection is calculated as the product of discharge and concentration. The effect of dispersion is presented according to Fick’s diffusion law as proportional to cross-sectional area and concentration gradient (∂c/∂x). The change of the mass flow in the distance dx is described using the Taylor series method, using only the first order term of change.
Fig 1.3. An ideal hydraulic element the change of the mass flow of which is described by means of advection and dispersion processes
The mass balance equation is formed by writing the rate of change of the amount of the substance considered on the left hand side of the equation (concentration = c). The differences between the incoming and outgoing mass flows as well as the effect of internal processes are written on the right hand side of the equation. The volume of the element is = Axdx. The differential dx is considered to be constant.
The mass balance equation has the following form: ∂(Axc) ∂∂∂c -------- dx = - --- (Axuc) dx + --- (AxDx --- ) dx + ∂t ∂x ∂x ∂x ScAxdx + SIdx (1.27) where: Dx = longitudinal (x axis) dispersion coefficient (L2T-1). Sc = the rate of change of the concentration c due to internal process (M L-3 T-1) SI = additional input per unit length (M L-1 T-1)
When the cross-sectional area, velocity of flow and dispersion coefficient are assumed to be constant equation (1.27) can be written in a simpler form: ∂c ∂2c _ ∂c SI --- = Dx --- - u --- + Sc + --- (1.28) ∂t ∂x2 ∂x Ax
The corresponding three-dimensional equation can be written as ∂c ∂2c ∂c ∂2c ∂c --- = Dx --- - u --- + Dy ---- - v + ∂t ∂x2∂x ∂y2∂y ∂2c ∂c SI Dz --- - w ---- + Sc + --- (1.29) ∂z2∂z Ax where: Dy = the dispersion coefficient of the direction y (L2 T-1) Dz = the dispersion coefficient of the direction z (L2 T-1) v = the velocity of flow in the direction y (L T-1) w = the velocity of flow in the direction z(L T-1).