Mastering Data Visualization: Tufte's Principles of Effective Graphical Displays
This exploration delves into Edward R. Tufte's influential work, "The Visual Display of Quantitative Information," highlighting key principles that define effective data graphics. By showcasing exemplary and poor graphics through historical examples, such as Minard's depiction of Napoleon's invasion and Playfair's economic illustrations, it emphasizes the importance of clarity, integrity, and the data-ink ratio. Tufte’s guidelines advocate for showing data variation, erasing non-essential ink, and meticulous editing to enhance the clarity and message of graphical representations.


Mastering Data Visualization: Tufte's Principles of Effective Graphical Displays
E N D
Presentation Transcript
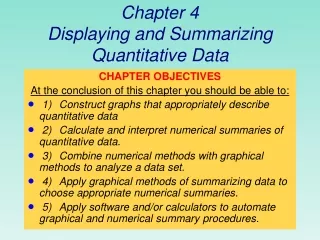
Displaying Quantitative Information An exploration of Edward R. Tufte’s The Visual Display of Quantitative Information Jeffrey Nichols Programming Usable Interfaces May 2, 2003
Good graphics Napolean’s invasion of Russia, as drawn by Charles Joseph Minard (1781-1870)
More good graphics The price of wheat compared to labour wages, William Playfair (1759-1823)
More good graphics French train schedule, as drawn by E.J. Marey (1830-1904)
More good graphics Map of the northern galactic hemisphere (1.3 million galaxies shown)
How can we make better graphics? Tufte presents some principles of data graphics • Above all else, show the data. • Maximize the data-ink ratio • Erase non-data-ink • Erase redundant data-ink • Revise and edit
Data-Ink • Ink that changes as the data changes • Non-redundant ink!
Data-Ink Ratio data-ink Data-ink ratio = Total ink used to print graphic = Proportion of a graphic’s ink devoted to the non-redundant display of data-information. = 1.0 – proportion of graphic that can be erased without the loss of information
What is the data-ink ratio of this graphic? Ratio of Histogram < 0.05 !!!
Ratio of USA Today Graphic • What is the data-ink ratio of this graphic? < 0.001
How can we make better graphics? Tufte presents some principles of data graphics • Above all else, show the data. • Maximize the data-ink ratio • Within reason • Every bit of ink on a graphic requires a reason • Erase non-data-ink • Erase redundant data-ink • Revise and edit
How can we make better graphics? Tufte presents some principles of data graphics • Above all else, show the data. • Maximize the data-ink ratio • Erase non-data-ink • Erase redundant data-ink • Revise and edit
Erase non-data-ink, within reason 11 5 2 1 0 18 7 Histogram of Midterm Results # of Students A- B+ A B B- C Scoring Buckets
Erase redundant data-ink 11 5 2 1 0 18 7 Histogram of Midterm Results # of Students A- B+ A B B- C Scoring Buckets
Erase redundant data-ink 18 11 5 2 1 0 7 Histogram of Midterm Results What’s the data-ink ratio? # of Students A- B+ A B B- C Scoring Buckets
How can we make better graphics? Tufte presents some principles of data graphics • Above all else, show the data. • Maximize the data-ink ratio • Erase non-data-ink • Erase redundant data-ink • Revise and edit
The Principles Applied to Common Forms Box Plots Maximum 75% Median 25% Minimum
The Principles Applied to Common Forms Box Plots Maximum 75% Median 25% Minimum
The Principles Applied to Common Forms Bar Graphs Modified Graph Original Graph
The Principles Applied to Common Forms Scatter Plots Modified Graph Original Graph
The Principles Applied to Common Forms Another Scatter Plot Variant
Conclusions • Show data variation, not design variation • Avoid using ink for non-data items • Avoid redundancy • Clear and detailed labeling should be used to defeat graphical distortion • Revise and Edit
Thanks for a great class! Reminder: Final Exam on Friday, May 9th at 8:30am in this room
Tufte’s Principles • Graphical Integrity • The representation of numbers, as physically measured on the surface of the graphic itself, should be directly proportional to the numerical quantities represented. • Clear, detailed, and thorough labeling should be used to defeat graphical distortion and ambiguity. Write out explanations of the data on the graphic itself. Label important events in the data. • Show data variation, not design variation. • In time-series displays of money, deflated and standardized units of monetary measurement are nearly always better than nominal units. • The number of information-carrying (variable) dimensions depicted should not exceed the number of dimensions in the data. • Graphics must not quote the data out of context. • Theory of Data Graphics • Above all else, show the data. • Maximize the data-ink ratio • Erase non-data-ink • Erase redundant data-ink • Revise and edit • Other comments • Graphical elegance is often found in simplicity of design and complexity of data • Data graphics are paragraphs about data and should be treated as such