Reactive Power and Voltage Control
890 likes | 2.13k Vues
Reactive Power and Voltage Control. Peter W. Sauer Department of Electrical and Computer Engineering University of Illinois at Urbana-Champaign. NSF Workshop on applied mathematics for deregulated power systems: Optimization, Control and Computational Intelligence

Reactive Power and Voltage Control
E N D
Presentation Transcript
Reactive Power and Voltage Control Peter W. Sauer Department of Electrical and Computer Engineering University of Illinois at Urbana-Champaign NSF Workshop on applied mathematics for deregulated power systems: Optimization, Control and Computational Intelligence Nov 3-4, 2003, Alexandria, VA
15 years of interesting stuff • Proceedings: Bulk Power System Voltage Phenomena - Voltage Stability and Security, Potosi, MO, Sep 19-24, 1988 • Proceedings NSF Workshop on Bulk Power System Voltage Phenomena Voltage Stability and Security, Deep Creek Lake, MD, Aug. 4-7, 1991 • Proceedings of the Bulk Power System Voltage Phenomena - III Seminar on Voltage Stability, Security & Control, Davos, Switzerland, August 22-26, 1994
15 years of interesting stuff • Proceedings of the Symposium on "Bulk Power System Dynamics and Control IV - Restructuring", Santorini, Greece, August 24-28, 1998 • Proceedings Bulk Power Systems Dynamics and Control V - Security and Reliability in a Changing Environment, Onomichi, Japan, August 26-31, 2001 • Proceedings Bulk Power Systems Dynamics and Control VI, Cortina, Italy, August 22-27, 2004
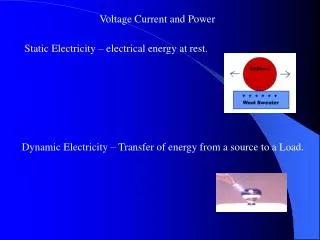
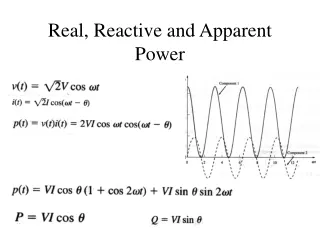
What is reactive power? • It is all in the phase shift
Deomposed into two terms P (1-cos(2wt)) P = .275 PU Watts - Q sin(2wt)) Q = 0.205 PU VARS
Steady-state frequency-domain model S = V I * = P + jQ Important thing here is that for a given amount of real power P, and a given voltage, the existence of Q causes current to be higher than necessary to provide P – i.e. VARS clog up the system
PQ capability curve • Shouldn’t just use fixed MVAR limit (MVAR limit is a function of MW dispatch) • Perhaps unit commitment should consider VAR support capability • More on this later 0
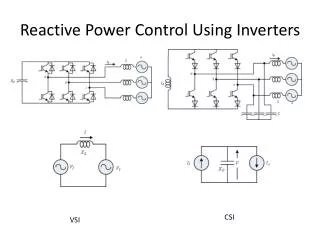
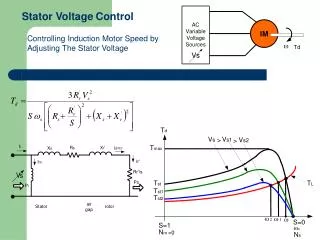
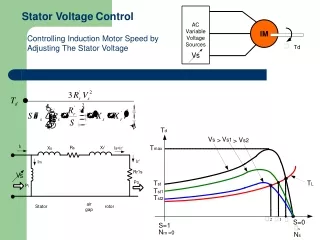
What is voltage control? • Generator excitation • TCUL transformers • Switched capacitors and inductors • SVC and other FACTS devices
Which is which and what is what? • VARS are the problem and the solution for voltage control • Transmission line losses (I2X) • Voltage drop (IX) • Local load compensation - current reduction • Response • Milliseconds to seconds • Zero to 1,000 MVARS • They do go long distances - just not very efficiently (Local supply is best)
A competitive environment • VARS are a commodity? • Voltage control is a service? • How do you allocate VAR losses? • How do you charge/compensate for voltage control?
Challenges in voltage control • Determining AVR set points and supplementary input signals • Modeling what really happens when excitation systems hit limits • Optimal placement and control of SVC and other VAR sources
Optimal Power Flow • Minimize total system costs subject to constraints
Generator voltage set-points MW interchanges (contract agreements) Equality Constraints • The power flow equations
Inequality Constraints • Generator Limits Line Limits Tap Limits Voltage Limits
Information from OPF solution • Marginal cost of real power in $/MWh at each system bus • Marginal cost of reactive power in $/MVARh at each system bus
Value of a Reactive Power Source • This example illustrates the use of a capacitor as a reactive power source for voltage control • It shows that a capacitor effects the available transfer capability • It shows the economic value of the VARS
Three-bus case with no area power transfer • No power transfer • Total Cost = $25,743/hr System Voltage Constraint 0.96 < Vi < 1.04
voltage constraint limits the power transfer Three-bus case with 15 MVAR support at load • Maximum power transfer = 244 MW • Total Cost = $21,346/hr = savings of $4,397/hr
voltage constraint limits the power transfer Three-bus case with 30 MVAR support at load • Maximum power transfer = 325 MW • Total Cost = $20,898/hr = additional savings of $448/hr
Three-bus case with 45 MVAR support at load • Maximum power transfer = 355 MW • Total Cost = $20,849/hr = additional savings of $49/hr voltage constraint does not limit “economic” power transfer
Relationships between maximum power transfer and voltage control • DC case - no VARS needed • AC case - VARS do help • AC case - even an infinite amount of VARS will not always help
One light on 14 Watts total (some light in room) Voltage drops some Two lights on 20 Watts total (room gets brighter) Voltage drops more Three lights on 23 Watts total (room gets brighter) Voltage drops more Four lights on 24 Watts total (room gets brighter) Voltage drops more Five lights on 25 Watts total (room gets brighter) Voltage drops more Six lights on 24 Watts total (room gets darker) Voltage drops more No lights on 0 Watts total (room is dark) Voltage is normal
Case 1: All Lines In-Service 3,000 MW transfer – 500 MW per line East generator is below 1,200 MVAR limit. Voltage is 100% of rated voltage.(300 MVARs required by lines). 25
Case 2: One Line Out 3,000 MW transfer – 600 MW per line East generator is below 1,200 MVAR limit. Voltage is 100% of rated voltage(362 MVARs required by lines). 26
Case 3: Two Lines Out 3,000 MW transfer – 750 MW per line East generator is at 1,200 MVAR limit. Voltage is 100% of rated (453 MVARs required by lines). 27
Case 4: Three Lines Out 3,000 MW transfer – 1,000 MW per line East generator is at 1,200 MVAR limit. Voltage is only 99% of rated (611 MVARs required by lines). 28
Case 5: Four Lines Out 3,000 MW transfer – 1, 500 MW per line East generator is at 1,200 MVAR limit. Voltage has dropped to 97% of rated voltage(957 MVARs required by lines). 29
Case 6: Five Lines Out System Collapse This simulation could not solve the case of 3,000 MW transfer with five lines out. Numbers shown are from the model’s last attempt to solve. The West generator’s unlimited supply of VARs is still not sufficient to maintain the voltage at the East bus. 30
Case 7: Two lines out - full voltage control (452 MVARs required by lines). 31
Case 8: Three lines out - full voltage control (606 MVARs required by lines). 32
Case 9: Four lines out - full voltage control (922 MVARs required by lines). 33
Case 10: Five lines out - full voltage control (2,000 MVARs required by lines). 34
Case 11: How much could this have handled? 4,900 MW 35
The challenge of security analysis • Traditional security analysis uses N-1 criteria (withstand the outage of one thing) • A challenging and useful margin would be to compute the minimum number of things that can be lost without resulting in cascading failure