Download
1 / 12
120 likes | 228 Vues
Explore the demographic trends in Niagara from 2001 to 2006, showcasing population growth, aging, Aboriginal and Francophone communities, diversity, employment, and more. Discover how Niagara's population is evolving and changing over time.

E N D
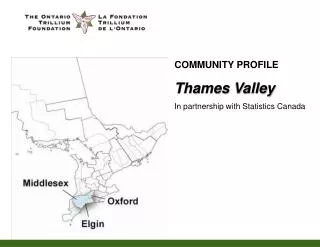
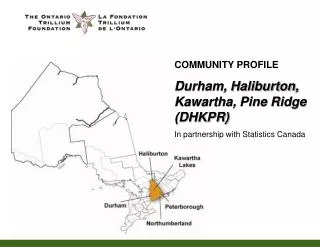
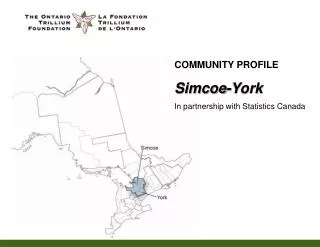
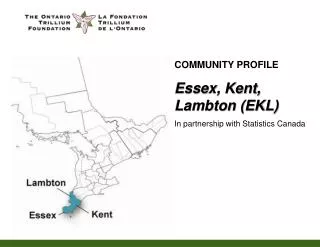
COMMUNITY PROFILE Niagara In partnership with Statistics Canada
Community Profile Highlights Highlights in Niagara (2001 to 2006): • Population is growing and aging • Strong growth in the Aboriginal community • Francophone community is getting smaller • Population is diverse • Employment is on the rise
Population is Growing In 2006, there were 427,421 people living in Niagara, which accounts for 3.5% of all Ontarians
Population is Growing Niagara is growing faster than in the previous five-year period Grimsby and West Lincoln’s growth rates (12.4 and 7.3%) exceed the provincial rate
An Aging Population • Niagara's population is amongst the oldest in the province • 17.4% of residents are aged 65 or older • Niagara had a smaller proportion of its population within working age than Ontario overall – 65.8% compared to 68.3% POPULATION BY MAJOR AGE GROUPS
Strong Growth in the Aboriginal Community • Niagara’s Aboriginal community grew by nearly 34% or 1,745 people • The 6,930 Aboriginal people in the Niagara region comprise 1.6% of the population, which is slightly lower than Ontario overall (2.0%) • Two-thirds of Niagara’s Aboriginal population live in St. Catharines (1,915), Niagara Falls (1,390) or Welland (1,185)
Francophone Community Shrinking • There were 115 fewer Francophones in Niagara in 2006 than in 2001, for a total of 15,510 • While Ontario’s Francophone community increased slightly (0.9%), Niagara’s Francophone community decreased slightly (-0.7%) • Francophones account for 3.6% of the region’s population and live mostly in Welland (40%) or St. Catharines (21%)
Population is Diverse • Foreign-born residents represent 18% of the total population • Immigrants are well-established as over half settled in Niagara prior to 1991 • Between 2001 and 2006 nearly half of Niagara's 7,890 newcomers settled in St. Catharines • One-third of Niagara’s newcomers (2,575) came from Asia and the Middle East • Overall, 70 different mother-tongue languages were reported in the region • The mother tongue of 1 in 6 residents were languages other than English or French
Community Profile Highlights Top Five Mother Tongues: (other than English & French) • ONTARIO • Italian • Chinese (not specified) • Cantonese • Spanish • German • NIAGARA • Italian • German • Dutch • Polish • Spanish
Community Profile Highlights • Also of Interest: • The youth population in Niagara is growing at the same rate as the province • Niagara has proportionately fewer children (14 years and younger) than the province overall • As of 2006 the number of employed workers had increased at a rate comparable to the province overall • The proportion of low-income families was well below the provincial average, especially in West Lincoln and Pelham
Additional Information This document presents highlights from the Niagara Community Profile To view the full report, please refer to the Ontario Trillium Foundation (OTF) website at www.trilliumfoundation.org There you will find the Community Profiles for OTF’s 16 catchment areas and the province overall The Community Profiles were produced in partnership with Statistics Canada, using the most recent 2006 Census information We hope that they will be of benefit to Ontario’s not-for-profit sector