Download
1 / 14
140 likes | 261 Vues
COMMUNITY PROFILE Northwestern In partnership with Statistics Canada. Community Profile Highlights. Highlights in Northwestern (2001 to 2006):. Overall total population almost unchanged, but community demographics are changing Growing Aboriginal Community Few newcomers

E N D
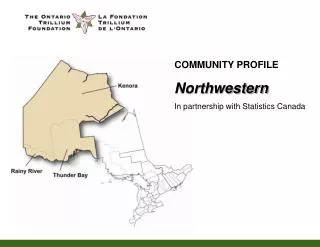
COMMUNITY PROFILE Northwestern In partnership with Statistics Canada
Community Profile Highlights Highlights in Northwestern (2001 to 2006): • Overall total population almost unchanged, but community demographics are changing • Growing Aboriginal Community • Few newcomers • Shrinking Francophone community • Mixed news in youth population
Population Unchanged In 2006, there were 253,046 people living in Northwestern, which accounts for 2% of all Ontarians
Population Unchanged Between 2001 and 2006, Northwestern’s total population remained largely unchanged, increasing by just 0.1%
Growing Aboriginal Community • Northwestern’s Aboriginal community has grown by 17.7% or 8,235 people • 46,455 or one in five people in Northwestern is Aboriginal
Strong Growth in Aboriginal Community The composition of Northwestern’s Aboriginal community is different than the rest of the province, with a higher proportion identifying themselves as First Nations and fewer as Métis * Multiple Aboriginal Identities ** Aboriginal Identities not included elsewhere
Few New Canadians • Close to 600,000 immigrants came to Ontario between 2001 and 2006; of those, just over 1,000 settled in Northwestern • The low rate of immigration to this region is reflective of a five decade trend • Less than 10% of residents reported being foreign-born in Northwestern, whereas 28% of Ontarians were born outside of Canada • The majority of foreign-born Northwestern residents established themselves long ago
Francophone Community Shrinking • In 2006, there were 985 fewer Francophones in Northwestern than in 2001 – an 11% decrease • Northwestern’s 7,805 Francophones account for 3.3% of the area’s population • More than three-quarters of Northwestern’s Francophone population is concentrated in the Thunder Bay district
Mixed News in Youth Ages 13 - 24 While Northwestern’s youth population increased more than its overall population (1.8% compared to 0.1%), this growth is less than Ontario overall (9.3%)
Community Profile Highlights Top Five Mother Tongues: (other than English & French) • ONTARIO • Italian • Chinese (not specified) • Cantonese • Spanish • German • NORTHWESTERN • Ojibway • Oji-Cree • Italian • Finnish • German
Community Profile Highlights • Kenora • Population is growing and has reversed the declining trend from the previous census • Kenora is home to almost 60% of the region’s Aboriginal community • Children account for 25% of Kenora residents, making it one of the youngest populations in Ontario • Kenora has the highest concentration of youth as a percentage of the overall population of any area in Ontario • Almost all (94%) of the real increases to Northwestern’s youth population occurred in Kenora
Community Profile Highlights • Also of Interest: • For the second time in a row, census figures show Rainy River and Thunder Bay both experienced a decrease in population • Though Rainy River has a higher proportion of older people than other areas, younger people (0-14) still account for 1 in every 5 people • Employment gains were greatest in Kenora and least in Thunder Bay • There is a huge disparity in income levels between residents living on reserve and those off-reserve
Additional Information This document presents highlights from the Northwestern Community Profile To view the full report, please refer to the Ontario Trillium Foundation (OTF) website at www.trilliumfoundation.org There you will find the Community Profiles for OTF’s 16 catchment areas and the province overall The Community Profiles were produced in partnership with Statistics Canada, using the most recent 2006 Census information We hope that they will be of benefit to Ontario’s not-for-profit sector