OBESITY
OBESITY. Primitive Life. Modern Life. Energy Expenditure. Energy Expenditure. Increase Expenditure. Expenditure> Intake. Intake> Expenditure. Reduce Intake. Limited Intake. Unlimited Intake. Energy Intake. Energy Intake.

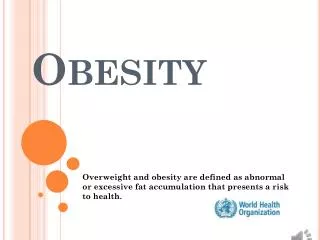
OBESITY
E N D
Presentation Transcript
Primitive Life Modern Life Energy Expenditure Energy Expenditure Increase Expenditure Expenditure>Intake Intake>Expenditure Reduce Intake Limited Intake Unlimited Intake Energy Intake Energy Intake Increase in Energy Stores Energy balance established at unhealthy weight. Low Energy Stores (body fat)
BMI and % body fat 9.1 % 21.2 % Source: THE LANCET • Vol 363 • January 10, 2004 • www.thelancet.com
18.5 23.0 27.5 25.0 30.0 35.0 40.0 WHO recommended BMI cut offs for Asians 2004 High Increased Acceptable Underweight Overweight Obesity I Obesity II Obesity III WHO international classification retained with new subcategories: BMI <18.5 – underweight BMI 18.5-23 – increasing but acceptable risk BMI 23–27·5 kg/m2 – increased BMI >27·5 kg/m2 - high risk. THE LANCET • Vol 363 • January 10, 2004 • www.thelancet.com
* * * * * * Main Risk Factors Related to Deaths in The Americas 2000
NR-Chronic Disease % preventable by diet/physical activity Science 2002
Body Mass Index of Adult Population Low BMI High BMI Peru Tunisia <16 16-16.9 17-18.4 >25 Colombia Brazil Costa Rica Cuba Morocco Chile Mexico Togo Zimbabwe China Mali Ghana Haiti Senegal Ethiopia % % India 0 60 50 30 20 10 10 20 30 40 50 60 40
Changes in Macronutrient Intake in Mexico 88/99 Protein CHO Fat % Calories North Center México, D.F. South National % Centro Norte México, D.F. Sur Nacional 1988 1999 1988 1999 1988 1999 1988 1999 1988 1999
Basic Causes Underlying Factors Nutrition Related Susceptibility (life-course exposure) Community empowerment demand for: safe & healthy foods, active life Public and private sector response to people’s health demands Government response in protection of public interest International and National framework policies: health, education, agriculture, economic, urbanization, recreation, transport, trade Legislative framework: to promote, support and protect right to safe and nutritious foods. Access to safe and healthy foods (quantity and quality) Balancing Energy Intake and expenditure Factors affecting food and PA supply chain Policies affecting marketing, advertisement, subsidies Urban space and facilities for active life (household school & workplace) Psycho-social determinants of food intake and PA Energy Balance Energy dense diets (fat &sugar) Physical Activity Appetite & food intake Control Pre & postnatal growth Macronutrient quality Micronutrient balance Hormonal response to diet Epigenetic Receptors Adipocyte Cell Growth genes OBESITY Hormones Genetic Monogenic Polygenic present efforts potential for future effectiveness
Nutrition Related Susceptibility (life-course exposure) Monogenic Polygenic Energy Balance Energy dense diets Physical Activity Appetite & food intake Control Pre & postnatal growth Macronutrient quality Micronutrient balance Hormonal response to diet Epigenetic Receptors Adipocyte Cell Growth genes OBESITY Hormones Genetic
The interaction of physical inactivity and dietary change on prevalence of obesity and other diet related NCDs Physical inactivity Dietary change + * ¯ FAT * + + + + + + BULK ¯ OBESITY ® DIABETES ® CHD vegetables Sex hormone tubers, cereals + changes - Colon CANCERS : breast Phytoestrogens n-3 fatty acids - endometrium. Folate, B Homocysteinemia Thrombosis ¯ ® ® 6 + + Trans fatty acids + Atherosclerosis Saturated fats ® - Antioxidants
Total fat Saturated Fats (C14,C16) Trans fatty acids Free sugars Refined starches Sodium/salt Preserved meats Vegetables, Fruits, legumes Fibre/NSP w - 3 fatty ac (LNA,EPA,DHA) Iron/iodine Zinc/folate? PHYSICAL ACTIVITY Principal nutrient/food changes Reduce Increase
Obesity prevention : a Life Course Approach Infancy andChildhood Elderly Adult Life Adolescence Established adult risky behaviours Diet/Physical activity, Tobacco, Alcohol Biological risks Socioeconomic status Environmental conditions Breast Feeding SES Infection PEM Micronutrients Growth rate Stature Physical Activity Food behaviour Obesity Sendentarism Inactivity Smoking Development of Obesity FetalLife SES Mother’s Nutrition Growth birth weight Accumulated risk Genetic susceptibility to Obesity Age Source: WHO/NMH/NPH/ALC, 2001
IOTF 2004 Obesity in children and young people: a crisis in public health • 10% of world’s children affected • Rates rising in • developing countries • Need for urgent action to • develop effective prevention • throughout the world Report to the World Health Organization
Prevalence and trends of overweight in preschool children from LA region Adapted from: de Onis M and Blössner M. Am J Clin Nutr 2000;72:1032-9.
CDC 1.36 2.7 NCHS 1.67 3.5 WHO 2.22 4.1 Weight for age of a 1 yr old boy weighing 12 kg according to reference used CDC 2000 NCHS 1974 WHO 2005
Energy Recommendations for Children FAO/WHO Boys Girls 1985 1985 based on intake data 2005 2005 Based on Expenditure data
Individual responsibility Change in the Environment Uauy and Monteiro 2004
Underlying Factors Access to safe and healthy foods (quantity and quality) Balancing Energy Intake and expenditure Factors affecting food and PA supply chain Urban space and facilities for active life (household school & workplace) Policies affecting regulation marketing, subsidies Psycho-social determinants of food intake and PA TO BE ACTIVE • Walk 15 km/wk • 3 km per day 30 min • 1 km in 10 min • 100 m in 1 min Agita Mundo OMS
Basic Causes Supply and demand side of food and PA chain. Community empowerment demand for: safe & healthy foods, active life Public and private sector response to people’s health demands Government response in protection of public interest International and National policies: health, education, agriculture, economic, urbanization, recreation, transport, trade Senators seek a trimmer America July 31, 2002 Posted: 10:31 AM EDT (1431 GMT) • Obesity is our nation's fastest rising public health problem," • "As a nation, we can no longer afford to ignore the escalating costs associated with obesity & unhealthy lifestyles, such as physical inactivity and poor dietary habits."
Who pays in the obesity war January 31, 2004 • Mirroring tobacco industry tactics, public-health needs are being stifled by business interests. • WHO Global Strategy on Diet, Physical Activity and Health calls for reductions in fat, salt, and sugar contents of foods, and recommends exercise to prevent obesity • High-fat, energy-dense foods are often the cheapest options for the consumer. • ….As long as a meal of grilled chicken, broccoli, and fresh fruit costs more, and is less convenient, than a burger and fries or a peanut butter sandwich, then the battle against obesity will be lost.