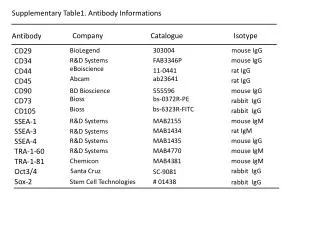
Quantitative Analysis of α-SMA Staining and Transcript Profiles in Tumor Models
170 likes | 289 Vues
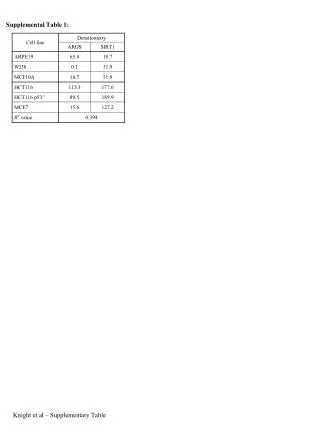
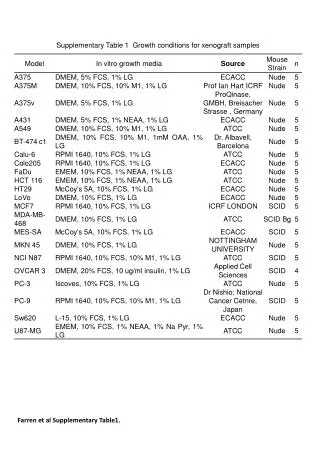
This supplementary material by Farren et al. presents detailed analysis on α-SMA staining in various human cell lines and their corresponding mouse xenografts. The datasets include histological staining results, linear regression analysis, and PCA scores, providing insights into cellular behavior in tumors. Results show significant correlations among key biomarkers such as VEGF, ANGPT-1, and FGF-2, with calculated P-values and R² values indicating strong relationships. This comprehensive examination enhances the understanding of tumor microenvironments and their molecular characteristics.

Quantitative Analysis of α-SMA Staining and Transcript Profiles in Tumor Models
E N D
Presentation Transcript
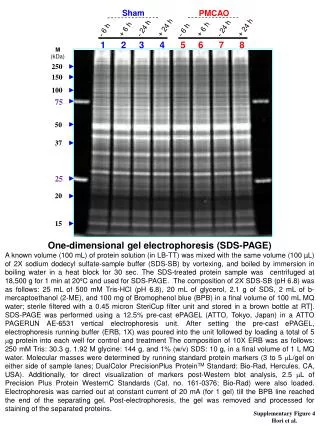
1 6 9 5 7 8 5 0 u o 5 v 1 9 6 7 3 9 A 3 M - - - c 1 2 0 6 4 2 F 7 5 3 4 8 D V R S 5 u C C 1 T 2 4 6 3 7 4 5 C N - o 4 a l N 7 A - P P o 3 S w A A A a H 7 F L T 3 I B M C l K A C E C 4 S o A C V - M M N M C H T - O A B D M a b 100 % 90 % 80 % 70 % 60 % % Human: Mouse mRNA 50 % 40 % 30 % 20 % G 10 % M - 7 8 U 0 % Human Proportion Mouse Proportion Farren et al Supplementary Figure 1
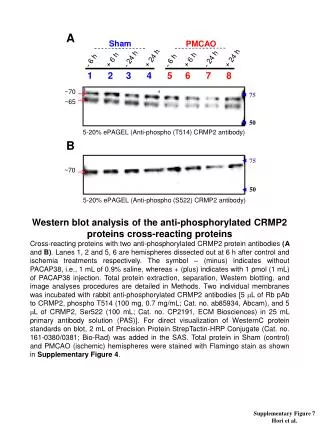
Low α-SMA staining <5% i U87MG ii LoVo iii A375M M I M iv A431 v Calu-6 vi HCT116 I M I Medium α-SMA staining 5% to 15% vii FaDu viii SW620 Iix BT474cl x HT29 E I E I xi PC9 xii Colo205 xiii A375 I E M High α-SMA staining >15% xiv A549 xv NCIN87 xvi MCF7 xvii PC3 I E E I Farren et al Supplementary Figure 3
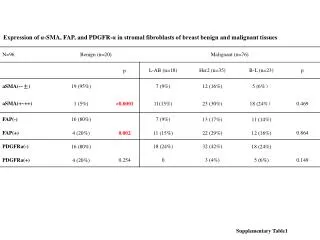
Farren et al Supplementary Table 2; Linear regression analysis of the quantified histological staining for α-SMA, F4/80 and MVD.
Tumour PCA Scores Plot Normalised to total 18s PC-2 PC-1 Farren et al Supplementary Figure 5
A. PCA analysis of human cell line transcript profile B. PCA analysis of human xenograft transcript profile Farren et al Supplementary Figure 6.
VEGF (-∆CT) ANGPT-1 (-∆CT) P Value = <0.001 R2 = 0.50 P Value = 0.004 R2 = 0.36 VEGF (log pg/ml) ANGPT-1 (log pg/ml) ANGPT-2 (-∆CT) FGF-2 (-∆CT) P Value = <0.001 R2 = 0.61 P Value = <0.001 R2 = 0.91 ANGPT-2 (log pg/ml) FGF-2 (log pg/ml) IL-8 (-∆CT) PGF (-∆CT) P Value = <0.001 R2 = 0.73 P Value = <0.001 R2 = 0.71 IL-8 (log pg/ml) PGF (log pg/ml) LoVo A375 MCF7 A375M MDA-MB-468 A375v Xenografts MES-SA A431 MKN 45 A549 NCI-N87 BT-474-c1 OVCAR 3 Calu-6 PC-3 Colo-205 PC-9 FaDu Sw620 HCT 116 U87-MG HT29 Farren et al Supplementary Figure 7
A Stromal PCA Scores Plot Normalised to total 18s PC-2 PC-1 B Stromal PCA Loading Plot Normalised to total 18s PC-2 PC-1 Farren et al Supplementary Figure 8