Download
1 / 7
70 likes | 178 Vues
Explore the impact of NRF2 knockdown and activation on miRNA expression in AML cells, assessing sensitivity to chemotherapy and identifying potential targets. Analysis conducted on THP-1 cells using lentiviral constructs and sulforaphane treatment.

E N D
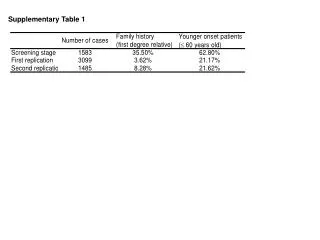
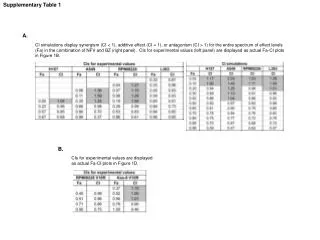
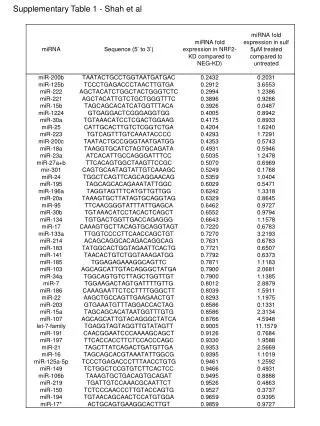
Supplementary table 1 (continued) - Shah et al Supplementary Table 1. miRNA profiling of AML cells in response lentiviral NRF2 knockdown and treatment with the NRF2 activator sulforaphane. THP-1 cells were either transduced with NEG (NEG-KD) and NRF2 (NRF2-KD) targeted miRNA lentiviral constructs or with sulforaphane (5µM) for 8 hours. QRTPCR analysis of 92 cancer-associated miRNAs in treated cells were evaluated. Values represent fold increase over control conditions normalized to RNU6B (ΔCT).
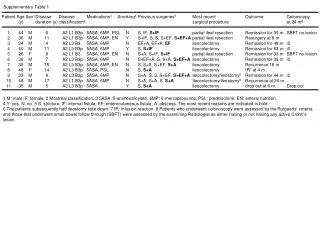
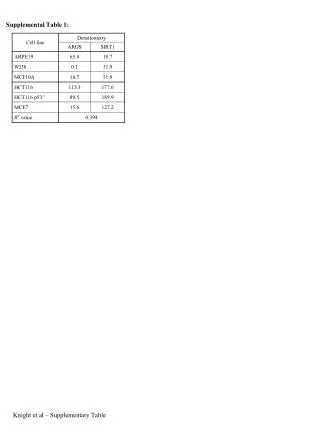
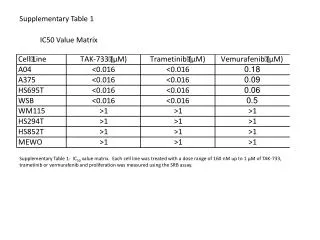
Supplementary Table 2 - Shah et al Supplementary Table 2. miR-125B antagomiR and miR-29B mimic increases AML sensitivity to chemotherapy. THP-1, Kasumi-1, primary CD34+ HSC, AML#25 and AML#27 were transfected with control miRNA, miR-125B antagomiR, miR-29B mimic and miR-125B antagomiR in combination with miR-29B mimic for 24 h before the addition of increasing doses of daunorubicin for 48 h. Cells assessed for viability by Cell Titer-GLO. Table shows the IC50 values for all cells types in response to daunorubicin
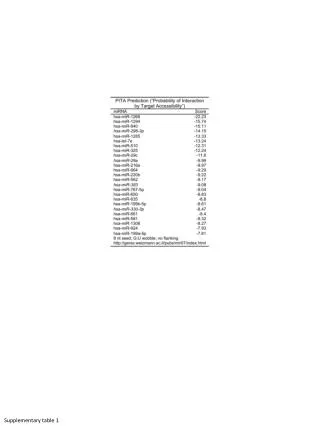
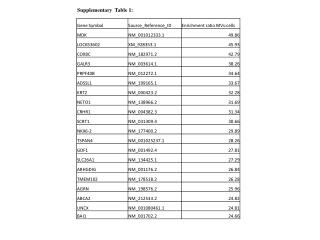
Supplementary Table 3 - Shah et al Supplementary Figure 3. Targets for miR-29B and miR-125B
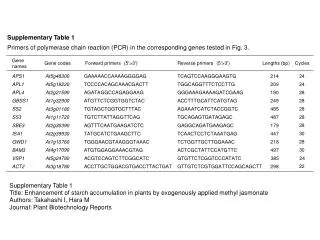
Supplementary Table 4 - Shah et al Supplementary Figure 4. Locations and sequences of putative ARE elements. Primers used in ChIP analysis.
Supplementary Figure 1 - Shah et al Fold miRNA expression over NEG-KD control Supplementary Figure 1. Expression analysis of miRNA levels after transfection with miR-29B mimic and miR-125B antagomir. THP-1 were transfected with control miRNA, miR-125B antagomiR (α125B), miR-29B mimic (29B mimic) and miR-125B antagomiR in combination with miR-29B mimic for 48 h. Also THP-1 cells were transduced with NEG (NEG-KD) and NRF2 (NRF2-KD) targeted miRNA lentiviral constructs for 72 hours. QRTPCR analysis of miR-29B and miR-125B was carried out on all transfected and transduced cells.
Supplementary Figure 2 - Shah et al A 15 miR-125B1 miR-125B P=0.0078 10 Fold RNA expression over CD34+ control P=0.0024 5 0 CD34+ AML Blasts CD34+ AML Blasts B 2.5 miR-29B1 miR-29B 2.0 Fold RNA expression over CD34+ control 1.5 P=0.003 P<0.001 1.0 0.5 0 CD34+ AML Blasts CD34+ AML Blasts Supplementary Figure 2. miR-29B and miR-125B in primary AML. Total RNA was extracted from patient AML blasts (n=18) and CD34+ HSC (n=8), miR-125B (A) and miR-29B (B) RNA expression levels were measured using QRTPCR and compared to miR-125B1 and miR-29B respectively from figure 4 A.