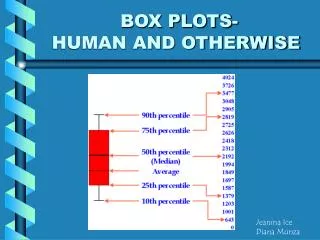
BOX PLOTS- HUMAN AND OTHERWISE
240 likes | 402 Vues
BOX PLOTS- HUMAN AND OTHERWISE. Jeanina Ice Diana Munza. Human Box Plot. Best done outside or in a gym or hallway. Place index cards or mark the floor at 1-foot intervals with the numbers 56 to 75 to represent the heights of the students in inches. .

BOX PLOTS- HUMAN AND OTHERWISE
E N D
Presentation Transcript
BOX PLOTS-HUMAN AND OTHERWISE Jeanina Ice Diana Munza
Human Box Plot Best done outside or in a gym or hallway. Place index cards or mark the floor at 1-foot intervals with the numbers 56 to 75 to represent the heights of the students in inches. . These numbers should be in a line parallel to the student line a few feet away. Have the students arrange themselves in a line according to their heights.
Have the students find the median person and have that person stand in front of the number that is his or her height. (If the median is between two people, chose one of them to stand in front of his height.) Then have the median student of each half of the split group stand in front of his or her height.
Have the first and last person in the line stand in front of their heights. You should have five people standing in a line away from the group, as in the diagram below.
Starting at one end, pass the clothesline from person To person among the five students who are standing on the numbers, having them hold the line as shown.
Discussion Guide a discussion on how this graph was formed. Upon re-turning to the classroom, the students can write their height data on the board and re-create the box plot on paper or in a calculator. Idea from: Advanced Algebra Through Data Exploration Key Curriculum Press
PULSE RATES Using Box Plots to compare two sets of measurements Have students measure and record their resting pulse rate for one minute
GET THE HEART RATE UP Exercise for two minutes by jumping or running in place
Collect the data from eachstudent in the class. COLLECT DATA
Insert Data into Calculators Make lists, then make a box and whisker plot Use trace to find quartiles
. ANALYZE DATA Analyze, interpret, and compare the graph’s measures of central tendency, and measures of spread. Have students write a few sentences that summarize their data.
The Statistics Song Mean, median, and mode Measures of central tendency And if you didn’t know Then you’re headed for a C-- minus Chorus: Statistics are some things We live by every day Study and earn your wings Or watch your degree – fly away
Measures of spread Are range and IQR If where you’re hurtin’ is your head You better –study your worksheets hard How do you find the mean? Ha!ha! It’s easier than you think Add up the numbers you know Divide it by – how many are shown Chorus Statistics are some things We live by every day Study and earn your wings Or watch your degree – fly away
Composed and Preformed by: A.J. R. and Paul K.
BOX PLOTS • Abstract • The goal of this lesson is to introduce box plots and quartiles. • An activity and discussion with supplemental exercises help • students learn how data can be graphically represented. • Objectives • Upon completion of this lesson, students will: • have reviewed the concept of median • have learned how to calculate quartiles for any size data set • have learned how to build a box plot
Standards The activities and discussions in this lesson address the following NCTM standards Algebra Understand patterns, relations, and functions. • represent, analyze, and generalize a variety of patterns with tables, graphs, words, and, when possible, symbolic rules; Use mathematical models to represent and understand quantitative relationships. • model and solve contextualized problems using various representations, such as graphs, tables, and equations. Data Analysis and Probability Formulate questions that can be addressed with data and collect, organize, and display relevant data to answer them. • select, create, and use appropriate graphical representations of data, including histograms, box plots, and scatterplots. Select and use appropriate statistical methods to analyze data. • discuss and understand the correspondence between data sets and their graphical representations, especially histograms, stem-and-leaf plots, box plots, and scatterplots
Color Samples – Data Collection and Analysis Group students in pairs. Distribute a bag of candy Per pair. Direct students To sort the candy by Color then count and record. Have students complete the Chart by determining the Ratios and calculating percents. Construct circle graph and bar Graph from data. Discuss Strengths of the two displays.
Have students compute the class totals, the percents, and finally have them find the mean and mode of the data. Students should then construct both class graphs. They should make conclusions about their graphs and the class graphs.
Box and Whiskers Plot • Using the ordering sheet, direct students to determine the largest and smallest number (extremes) and the quarter dividers (quartiles) for each color. • Have students construct a box and whisker plot for each of the colors and the total candy package.
Have students construct a box and whisker plot for each color using the graphing calculator. Students will be able to verify the accuracy of the box and whiskers, which they had previously constructed.
Finally, have students complete the journal activity. The purpose o f this activity is to introduce students to some concepts and techniques of data analysis in which they will: 1. discover the strengths and weaknesses of different displays 2.see the effects of using larger samples of data 3.learn to compare the range of different sets of data 4.learn how to use the graphing calculator to display the data
But we had to feed thempizza first!! A good time was had by all