Download

1 / 20
200 likes | 308 Vues
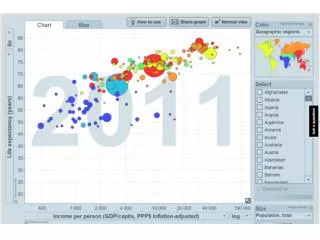
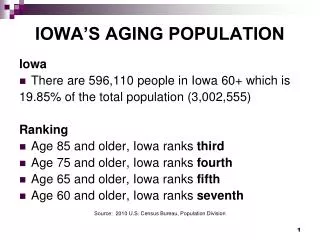
CEE countries – Europe ‘ s „Iowa “ ?. Thomas Preuße DLG-Mitteilungen Frankfurt. Produktivitätspotentiale. General Competiveness (WEF 2011, 142 countries). 1. Switzerland 6. Germany 19. Austria 48. Hungary 77. Croatia 78. Romania 95. Serbia. Agriculture: Pro CEE.

E N D
CEE countries – Europe‘s „Iowa“? Thomas Preuße DLG-Mitteilungen Frankfurt
General Competiveness (WEF 2011, 142 countries) 1. Switzerland 6. Germany 19. Austria 48. Hungary 77. Croatia 78. Romania 95. Serbia
Agriculture: Pro CEE Soil + climate conditions Transport via Danube Importance of agriculture for the economy Partly well developed agribusiness Quality instead of commodity? EU membership or at least step-by-step implementation of EU rules ...?
Agriculture: Contra CEE Many very small farms with poor productivity Lack of capital Quality standards Infrastructure (irrigation!) Business relations not always transparent Bureaucracy ...
Some statistics Corn Iowa 5,7 Mio. ha Corn H, RO, SRB, HR ca. 5 Mio. ha Soybean Iowa 3,8 Mio. ha Soybean H, RO, SRB, HR 0,3 Mio. ha = Iowa soybean/corn 1 : 1,5 = CEE-4 soybean/corn 1 : 15
More statistics Romania: 700.000 ha sunflowers, but not more than 50.000 ha soybeans Hungary almost the same relation But Serbia ca. 50 : 50 WHY THAT???
Farmers in Romania say... Weed pressure Poor nutrient content (P/K) Sunflowers easier to grow and better under dry conditions Soybean prices 10-15% lower than sunflower prices Risk of contamination with GMO beans
Serbia, a special case Since 2009 no import of GMO feedstuff Soymeal almost completely for domestic use High prices for feed Subsidies for soybean growers (ca. 30 €/t) Farmers depending highly from processors (few capital for inputs) – no free choice
Becej in Serbia – largest soya processing plant in the region
A fast look to Brazil Non-GMO max. 20% of soya production, but not completely certified Next yield almost sold Main problem for Non-GMO beans: Few research = declining competiveness Premiums for Non-GMO only 4-6 €/t
General conclusions CEE has a natural „Iowa potential“ and a lot of still unlifted opportunities But political reliability and business climate often have to be improved Of course there is a wide gap between e.g. Hungary and Serbia (or Albania!) EU framework is crucial
Soybean conclusions Corn and sunflowers seem more attractive for the farmers in Hungary and Romania Serbia needs most of its soybean meal for feeding the own livestock Non-GMO beans from Brazil are still (too) cheap But further demand of non-GMO and more GMO in Brazil may change this
Political opportunities (“I have a dream...“) Serbia follows the pressure from US, EU etc. and lifts the GMO ban for imported SBM. This means lower costs for the livestock farmers and the (often quite poor) consumers. And gives the opportunity for more Non-GMO exports. EU accepts N collecting crops for the 7% Ecological Favourite Areas