Download
1 / 12
120 likes | 261 Vues
Pflügers Archiv - European Journal of Physiology. Stromal interaction molecule 1 (STIM1) regulates sarcoplasmic/endoplasmic reticulum Ca 2+ -ATPase 1a (SERCA1a) in skeletal muscle Keon Jin Lee 1 , Changdo Hyun 1 , Jin Seok Woo 1 , Chang Sik Park 2 , Do Han Kim 2 , Eun Hui Lee 1,*

E N D
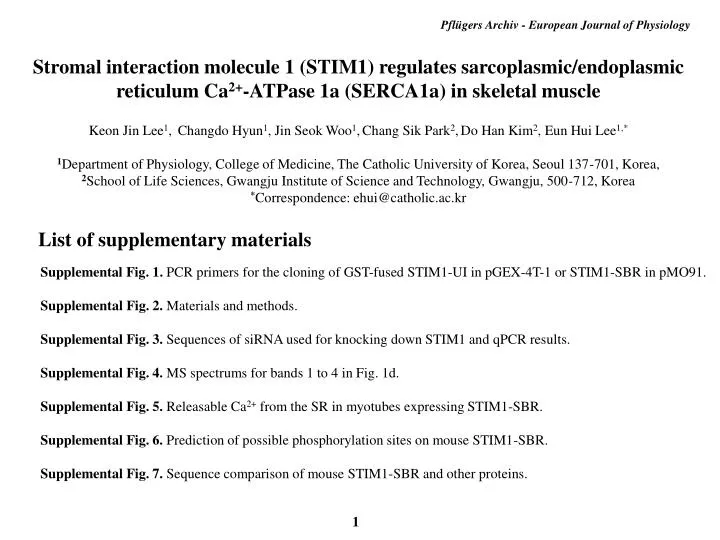
Pflügers Archiv - European Journal of Physiology Stromal interaction molecule 1 (STIM1) regulates sarcoplasmic/endoplasmic reticulum Ca2+-ATPase 1a (SERCA1a) in skeletal muscle Keon Jin Lee1,Changdo Hyun1, Jin Seok Woo1,Chang Sik Park2,Do Han Kim2, EunHui Lee1,* 1Department of Physiology, College of Medicine, The Catholic University of Korea, Seoul 137-701, Korea, 2School of Life Sciences, Gwangju Institute of Science and Technology, Gwangju, 500-712, Korea *Correspondence: ehui@catholic.ac.kr List of supplementary materials Supplemental Fig. 1. PCR primers for the cloning of GST-fused STIM1-UI in pGEX-4T-1 or STIM1-SBR in pMO91. Supplemental Fig. 2. Materials and methods. Supplemental Fig. 3. Sequences of siRNA used for knocking down STIM1 and qPCR results. Supplemental Fig. 4. MS spectrums for bands 1 to 4 in Fig. 1d. Supplemental Fig. 5. Releasable Ca2+ from the SR in myotubes expressing STIM1-SBR. Supplemental Fig. 6. Prediction of possible phosphorylation sites on mouse STIM1-SBR. Supplemental Fig. 7. Sequence comparison of mouse STIM1-SBR and other proteins. 1
Supplemental Figure 1 PCR primers for the cloning of GST-fused STIM1-UI in pGEX-4T-1 or STIM1-SBR in pMO91. 2
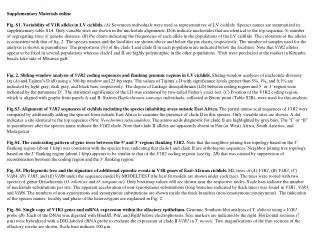
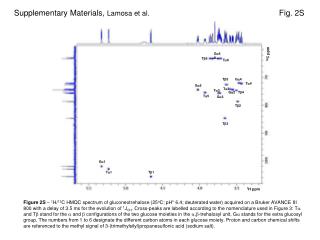
Supplemental Figure 2 Materials and methods. (A) Binding assay of GST-fused STIM1-UI protein with triad proteins. Briefly, affinity beads were prepared by immobilizing GST-fused STIM1-UI proteins on GST beads (Amersham Biosciences, Pittsburgh, PA, USA). The affinity beads were then incubated with 150 μg of the solubilized triad vesicle sample from rabbit skeletal muscle for 8 h at 4 °C. The proteins that were bound to the affinity beads were separated on a 10% SDS-PAGE gel, and the gel was stained with Coomassie Blue in order to obtain the protein bands that were specifically bound to the GST-fused STIM1-UI protein for qTOF MS and database searches. (B) Protein identifications by qTOF MS and database searches. The digested peptide solution by the in-gel digestion with trypsin was desalted and concentrated, and was eluted using a homemade C18 nano-column (100-300 nl with trypsin of POROS reverse-phase R2 material (20–30 μm in bead size, PerSeptive Biosystems, Foster City, CA, USA)) and 1.5 ul of 50% MeOH, 49% H2O, and 1% HCO2H. qTOF MS of the eluted peptides was performed by Hybrid Quadrupole-TOF LC/MS/MS Mass Spectrometer (AB Sciex Instruments, Framingham, MA, USA) equipped with an electrospray ionization (ESI) source. Source temperature, room temperature; potential, 1 kV; flow rate, 10–30 nl/min; cone voltage, 40 V; collision gas and energy, Ar at a pressure of 6-7 x 10⁻⁵ mbar and 25–40 V. A quadrupole analyzer was used to select precursor ions for the fragmentation in the hexapole collision cell. The produced ions were analyzed using an orthogonal TOF analyzer and fitted with a reflector, a micro-channel plate detector, and a time-to-digital converter. Mode, ESI+; MS parameter and scan type, positive TOF MS; intensity threshold, 1 count; MCA No., GS1: 2.00 and GS2: 0.00; CUR, 30.00; IS, 1000.00; CID, 50~55; scan range and rate, m/z 50-2000 and 2 sec/scan. Database searches were conducted using the Mascot server (www.matrixscience.com). Type of search, MS/MS ion search; enzyme, trypsin; fixed modifications, carbamidomethyl (C); variable modifications, oxidation (M); mass values, monoisotopic; protein mass, unrestricted; peptide mass tolerance, ±1 Da; fragment mass tolerance, ±0.6 Da; max missed cleavages, 1; instrument type, default; number of queries, 1. 3
Supplemental Figure 2 (continued) (C) Co-immunoprecipitation assay, immunoblot assay, and immunocytochemistry. For the co-immunoprecipitation assay, the solubilized triad vesicle sample from rabbit skeletal muscle (800 µg of total protein) was incubated with anti-STIM1 (10 μg/ml, abcam, Cambridge, MA, USA) or anti-SERCA1a antibody (10 μg/ml, abcam, Cambridge, MA, USA)overnight at 4 °C, followed by incubation with Protein G–Sepharose beads (Amersham Biosciences, Pittsburgh, PA, USA) for 4 h at 4 °C. Beads were washed five times with a buffer (10 mM Tris-HCl, 1 mM Na3VO4, 10% glycerol, 150 mM NaCl, 5 mM EDTA, and Protease Inhibitor Cocktail Tablets (Roche, Switzerland), and pH 7.4). Bound proteins were eluted by boiling in a SDS sample buffer and were subjected to SDS-PAGE (10% gel) followed by immunoblot assay with anti-STIM1 (1:1,000) or anti-SERCA1a antibody (1:1,000). For the immunocytochemistry, the myotubes were fixed in cold methanol (-20 °C) for 15 min and permeabilized with 0.05% Tween 20 in phosphate-buffered saline (PBS) for 1 min. After blocking with 2% normal goat serum (NGS) in PBS, the myoblasts were incubated with anti-STIM1 (1:500), anti-SERCA1a (1:200, Cell Signaling Technology, Danvers, MA, USA), or anti-CFP antibodies (1:500, Cell Signaling Technology, Danvers, MA, USA) for 3 h, washed three times with 2% NGS in PBS for 10 min, incubated with a Cy-3-conjugated anti-mouse (1:2,000, Jackson ImmunoResearch, West Grove, PA, USA) or FITC-conjugated anti-rabbit secondary antibody (1:200, Sigma-Aldrich, St. Louis, MO, USA) for 45 min at room temperature, and visualized with an inverted fluorescence microscope using a 40x objective lens (ECLIPSE Ti, Nikon Instruments, Melville, NY, USA) equipped with a monochrome camera (ProgRes MF, JENOPTIK Optical Systems, Jupiter, FL, USA). 4
Supplemental Figure 3 Sequences of siRNA used for knocking down STIM1 and qPCR results. #2 siRNA knocked down STIM1 more efficiently, and was used for the subsequent experiments. The results were adopted from our previous study (Lee KJ, Woo JS, Hwang JH, Hyun C, Cho CH, Kim DH, Lee EH (2013) STIM1 negatively regulates Ca2+ release from the sarcoplasmic reticulum in skeletal myotubes. Biochem J 453(2):187-200). 5
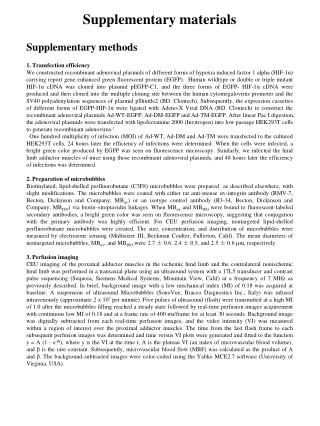
Supplemental Figure 4 MS spectrums for bands 1 to 4 in Fig. 1d. • (A) MS spectrum of band 1. No matching signal 6
(B) MS spectrum of band 2. Identified (SERCA1a from rabbit) 7
(C) MS spectrum of band 3. Identified (Chain A, chaperonin groel from E.coli) 8
(D) MS spectrum of band 4. (Chain A, Ompf porin mutant D74a from E.coli) Identified Identified 9
Supplemental Figure 5 Releasable Ca2+ from the SR in myotubes expressing STIM1-SBR. To measure the releasable Ca2+ from the SR to the cytosol, the myotubes loaded with fluo-5N (which detects higher levels of Ca2+ ranging from μM to mM) were incubated in the imaging solution with zero Ca2+ for 5 min and then were treated with caffeine. The releasable Ca2+ is summarized as histograms (the area under the curve was normalized to the mean value of those from the control vectors). The releasable Ca2+ from SR to the cytosol was increased by STIM1-SBR. *Significant difference compared with the control vector (p < 0.05). 10
Supplemental Figure 6 Prediction of possible phosphorylation sites on mouse STIM1-SBR. Phosphorylation sites for mouse STIM1-SBR were predicted using NetPhos (Blom N, Gammeltoft S, Brunak S (1999) Sequence and structure-based prediction of eukaryotic protein phosphorylation sites. J Mol Biol294(5): 1351-1362). Twenty-five serines and three threonines were predicted as possible phosphorylation sites. Two phosphorable amino acids in helix I in Fig. 7a are indicated by red lines. A higher score means a higher possibility for phosphorylation. Numbers indicate the amino acid sequences of mouse STIM1-SBR. The first and the last amino acids of the STIM1-SBR are presented as numbers 1 and 223, respectively. Pos, position; Pred (V in Context), predicted phosphorylation site. 11
Supplemental Figure 7 Sequence comparison of mouse STIM1-SBR and other proteins. Using RaptorX (Kallberg M, Wang H, Wang S, Peng J, Wang Z, Lu H, Xu J (2012) Template-based protein structure modeling using the RaptorX web server. Nat Protoc7(8):1511-1522), the amino acid sequence of mouse STIM1-SBR was compared with those of proteins with 3D structures that were previously known. 1gg9, 1gge, 1ggj, 1p80, 1p81 or 1qws is the PDB ID of heme-dependent catalase HPII or one of its five mutants (H128N, wild-type HPII, N201A, D181Q, D181E, or D181N, respectively).Red letter, small, hydrophobic, or aromatic amino acid, but not Y; blue letter, acidic amino acid; magenta, basic amino acid; green, hydroxyl, amine, or amide amino acid; gray, other amino acids; *, identical amino acid; :, conserved substitution (the same color group); ∙, semi-conserved substitution (similar shape). The homology for amino acid sequences between mouse STIM1-SBR and HPII or one of its five mutants was approximately 29%. 12

![[Supplementary materials]](https://cdn1.slideserve.com/2110594/slide1-dt.jpg)