Supplementary materials Supplementary methods 1. Transfection efficiency
60 likes | 225 Vues
Supplementary materials Supplementary methods 1. Transfection efficiency

Supplementary materials Supplementary methods 1. Transfection efficiency
E N D
Presentation Transcript
Supplementary materials Supplementary methods 1. Transfection efficiency We constructed recombinant adenoviral plasmids of different forms of hypoxia induced factor 1 alpha (HIF-1α) carrying report gene enhanced green fluorescent protein (EGFP). Human wildtype or double or triple mutant HIF-1α cDNA was cloned into plasmid pEGFP-C1, and the three forms of EGFP- HIF-1α cDNA were produced and then cloned into the multiple cloning site between the human cytomegalovirus promoter and the SV40 polyadenylation sequences of plasmid pShuttle2 (BD. Clontech). Subsequently, the expression cassettes of different forms of EGFP-HIF-1α were ligated with Adeno-X Viral DNA (BD. Clontech) to construct the recombinant adenoviral plasmids Ad-WT-EGFP, Ad-DM-EGFP and Ad-TM-EGFP. After linear Pac I digestion, the adenoviral plasmids were transfected with lipofectamine 2000 (Invitrogen) into low passage HEK293T cells to generate recombinant adenovirus.1 One hundred multiplicity of infection (MOI) of Ad-WT, Ad-DM and Ad-TM were transfected to the cultured HEK293T cells, 24 hours later the efficiency of infections were determined. When the cells were infected, a bright green color produced by EGFP was seen on fluorescence microscopy. Similarly, we infected the hind limb adductor muscles of mice using those recombinant adenoviral plasmids, and 48 hours later the efficiency of infections was determined. 2. Preparation of microbubbles Biotinylated, lipid-shelled perfluorobutane (C3F8) microbubbles were prepared as described elsewhere, with slight modifications. The microbubbles were coated with either rat anti-mouse αv-integrin antibody (RMV-7, Becton, Dickinson and Company; MBαv) or an isotype control antibody (R3-34, Becton, Dickinson and Company; MBISO) via biotin–streptavidin linkages. When MBαv and MBISO were bound to fluorescent-labeled secondary antibodies, a bright green color was seen on fluorescence microscopy, suggesting that conjugation with the primary antibody was highly efficient. For CEU perfusion imaging, nontargeted lipid-shelled perfluorobutane microbubbles were created. The size, concentration, and distribution of microbubbles were measured by electrozone sensing (Multisizer III, Beckman Coulter, Fullerton, Calif). The mean diameters of nontargeted microbubbles, MBαv, and MBISO were 2.7 ± 0.6, 2.4 ± 0.5, and 2.5 ± 0.6 µm, respectively. 3. Perfusion imaging CEU imaging of the proximal adductor muscles in the ischemic hind limb and the contralateral nonischemic hind limb was performed in a transaxial plane using an ultrasound system with a 17L5 transducer and contrast pulse sequencing (Sequoia, Siemens Medical Systems, Mountain View, Calif) at a frequency of 7 MHz as previously described. In brief, background image with a low mechanical index (MI) of 0.18 was acquired at baseline. A suspension of ultrasound Microbubbles (SonoVue, Bracco Diagnostics Inc., Italy) was infused intravenously (approximate 2 x 10⁷ per minute). Five pulses of ultrasound (flash) were transmitted at a high MI of 1.0 after the microbubbles filling reached a steady state followed by real-time perfusion images acquirement with continuous low MI of 0.18 and at a frame rate of 400 ms/frame for at least 30 seconds. Background image was digitally subtracted from each real-time perfusion images, and the video intensity (VI) was measured within a region of interest over the proximal adductor muscles. The time from the last flash frame to each subsequent perfusion images was determined and time versus VI plots were generated and fitted to the function y = A (1 - e-βt), where y is the VI at the time t, A is the plateau VI (an index of microvascular blood volume), and β is the rate constant. Subsequently, microvascular blood flow (MBF) was calculated as the product of A and β. The background-subtracted images were color-coded using the Yabko MCE2.7 software (University of Virginia, USA).
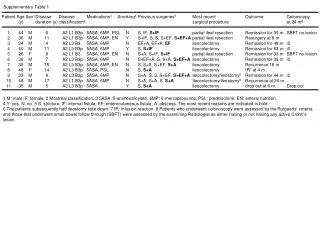
4. Histological examinations Staining was performed on frozen or 4% paraformaldehyde fixed proximal hind limb adductor muscle sectioned in the transaxial plane. Sections were stained with biotin-conjugated Bandeiraea Simplicifolia-1 (BS-1, 1:1000, Sigma, USA) lectin, NCAM1/CD56 (1:100, Backton DickBecton Dickinson)and Desmin (1:100, Abcam) antibodies to detect capillaries, satellite cells and myogenesis in the muscle, respectively as described elsewhere2, 3. Detection of arterioles was performed in the sections stained with rabbit anti-mouse smooth muscle α-actin antibody (1:200, Abcam, UK). For analysis of αv-integrin expression, frozen sections were incubated with rabbit anti-mouse αv-integrin antibody (1:1000, Millipore, USA). All the slides were examined under a fluorescent microscope (Olympus, Japan). Quantitative assessments, including the capillary to muscle fiber,4, 5 the number of arteries and positive αv-integrin staining vessels per high power field6 were determined and calculated from five randomly chosen fields for each sample. Any endothelial cell or endothelial cell cluster positive for αv-integrin and clearly separate from an adjacent cluster was considered to be a single countable microvessel.7 Analysis was blinded to animal identity. Supplementary table 1. Sequence of PCR primers Supplementary references 1. Li M, Liu C, Bin J, Wang Y, Chen J, Xiu J, Pei J, Lai Y, Chen D, Fan C, Xie J, Tao Y, Wu P. Mutant hypoxia inducible factor-1alpha improves angiogenesis and tissue perfusion in ischemic rabbit skeletal muscle. Microvasc Res.81:26-33 2. Lian Q, Zhang Y, Zhang J, Zhang HK, Wu X, Lam FF, Kang S, Xia JC, Lai WH, Au KW, Chow YY, Siu CW, Lee CN, Tse HF. Functional mesenchymal stem cells derived from human induced pluripotent stem cells attenuate limb ischemia in mice. Circulation. 2010;121:1113-1123 3. Kadi F, Schjerling P, Andersen LL, Charifi N, Madsen JL, Christensen LR, Andersen JL. The effects of heavy resistance training and detraining on satellite cells in human skeletal muscles. J Physiol. 2004;558:1005-1012 4. Shintani S, Murohara T, Ikeda H, Ueno T, Sasaki K, Duan J, Imaizumi T. Augmentation of postnatal neovascularization with autologous bone marrow transplantation. Circulation. 2001;103:897-903 5. Patel TH, Kimura H, Weiss CR, Semenza GL, Hofmann LV. Constitutively active hif-1alpha improves perfusion and arterial remodeling in an endovascular model of limb ischemia. Cardiovasc Res. 2005;68:144-154 6. Li L, Okada H, Takemura G, Esaki M, Kobayashi H, Kanamori H, Kawamura I, Maruyama R, Fujiwara T, Fujiwara H, Tabata Y, Minatoguchi S. Sustained release of erythropoietin using biodegradable gelatin hydrogel microspheres persistently improves lower leg ischemia. J Am Coll Cardiol. 2009;53:2378-2388 7. Foote RL, Weidner N, Harris J, Hammond E, Lewis JE, Vuong T, Ang KK, Fu KK. Evaluation of tumor angiogenesis measured with microvessel density (mvd) as a prognostic indicator in nasopharyngeal carcinoma: Results of rtog 9505. Int J Radiat Oncol Biol Phys. 2005;61:745-753
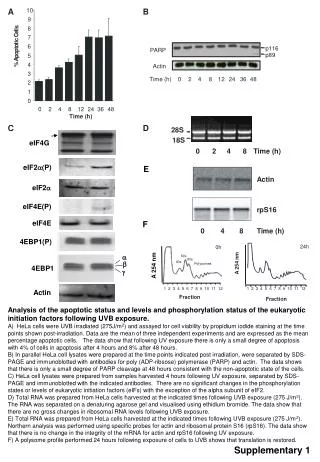
A Under Fluorescence Light Under Normal Light Ad-WT Ad-DM Ad-TM B Under Fluorescence Light Under Normal Light Ad-WT Ad-DM Ad-TM C Transfection /infectionefficiency Figure S1. Transfection/infection efficiency in different groups. (A) Transfection of adenovirus with different forms of HIF-1α in HEK293 T cultured cells was examined by fluorescence microscopy. (B) Infection of adenovirus with different forms of HIF-1α in the hind limb adductor muscle of mice. (C) Transfect efficiency in vitro (n = 3 wells in each group) and infection efficiency in vivo (n = 3 in each group). Scale bar = 50 μM.
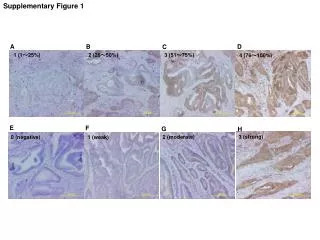
Ad-WT Ad-LacZ Day 3 Ad-DM Ad-TM Ad-WT Ad-LacZ Day 7 Ad-DM Ad-TM Ad-WT Ad-LacZ Day 14 Ad-TM Ad-DM Figure S2. Representative images of v-integrins expression in ischemic adductor muscles on days 3, 7 and 14, respectively. Scale bar = 50m.
Non-ischemia Ad-TM Ad-DM Ad-WT Ad-LacZ Video Intensity (arbitrary units) Time (s) Figure S3. Examples of fitting curves for perfusion imaging. The five curves from the bottom up are one mice from Ad-LacZ, Ad-WT, Ad-DM and Ad-TM treated groups and non-ischemia limb, respectively. y = A (1 - e-βt), where y is the VI (video intensity) at the time t, A is the plateau VI (an index of microvascular blood volume), and β is the rate constant. As shown in Figure 5B, microvascular blood flow (MBF) was calculated as the product of A and β.
A HE staining Negative control CD56 staining Zooming in B HE staining Negative control Desmin staining Zooming in C ** ** ** ** * * Desmin positive area (%) Satellite cells (number/HPF) ** ** Figure S4. Immunohistochemistry results of CD56 and desmin staining in the ischemic muscle on day 7. (A) Examples of satellite cells stained by CD56 antibody (indicated by arrows). (B) Examples of desmin staining in the ischemic muscle. (C) Quantization of satellite cells and desmin stained area in different groups (n = 5 in each group). *P<0.05, **P<0.01. HE: hematoxylin and eosin staining,HPF:high power field. Scale bar = 50 μM.
![[Supplementary materials]](https://cdn1.slideserve.com/2110594/slide1-dt.jpg)