CO2 Measurements in Fungal Microcosms: Analysis of Glycerol Utilization
This study examines CO2 measurements over time in fungal microcosms with variations in temperature, HPLC profiles, and glycerol amounts in different compartments. Detailed analysis and comparisons provided.

CO2 Measurements in Fungal Microcosms: Analysis of Glycerol Utilization
E N D
Presentation Transcript
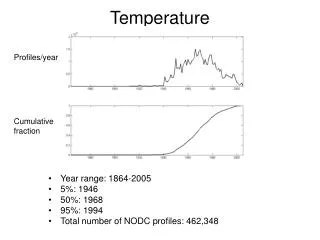
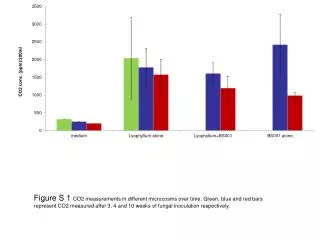
Figure S 1 CO2 measurements in different microcosms over time. Green, blue and red bars represent CO2 measured after 3, 4 and 10 weeks of fungal inoculation respectively.
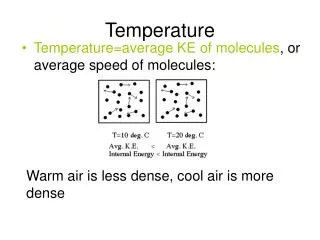
Temperature (0C) Figure S 2 Fluctuations in air temperature over time in the environment where MFM microcosms were incubated.
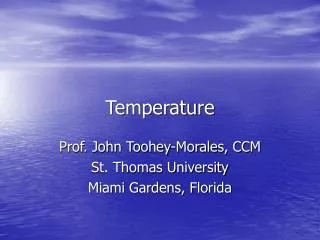
f+b medium Medium alone f+b exudates Medium +F Glycerol 2 3 Figure S 3 HPLC profiles from different microcosms. x-axis shows the detention time for each compound that is represented as a peak.
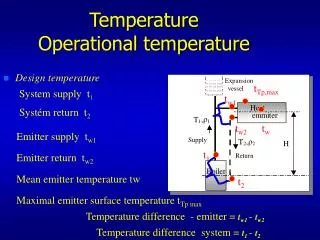
m1 Figure S 4 Amount of Glycerol measured in different compartments over time. m; compartment of MFM microcosm below fungal mat in the absence of any bacteria, b; compartment of MFM microcosm beneath fungal mat in the presence of BS001, E; compartment of MFM microcosm on fungal mat surface in the presence of BS001, digits 1,2,3,4 indicate 1st, 2nd, 3rd, 4th sampling after 4, 7, 12 and 15-days of bacterial inoculation respectively.