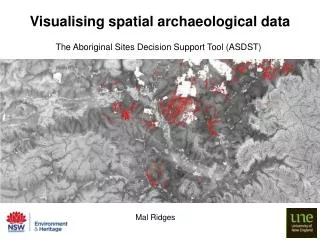
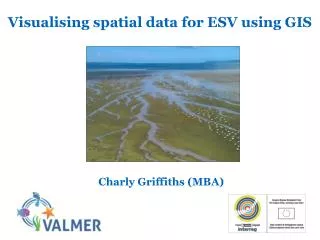
Visualising spatial data for ESV using GIS
Geographic Information Systems (GIS) integrate technology and data to visualize and analyze spatial information. This approach enhances our understanding of locations, quantities, and densities of various entities, allowing for an in-depth examination of relationships and trends. Applications include marine spatial planning, ecosystem service valuations, and environmental management. This resource presents key outputs from various studies, demonstrating GIS's role in mapping the marine environment, assessing vulnerability, and informing conservation efforts. It highlights the importance of understanding changes over time.

Visualising spatial data for ESV using GIS
E N D
Presentation Transcript
Visualising spatial data for ESV using GIS Charly Griffiths (MBA)
What is GIS? A geographic information system (GIS) integrates hardware, software, and data for capturing, managing, analyzing, and displaying all forms of geographically referenced information. GIS allows us to view, understand, question, interpret, and visualize data in many ways that reveal relationships, patterns, and trends in the form of maps, globes, reports, and charts.
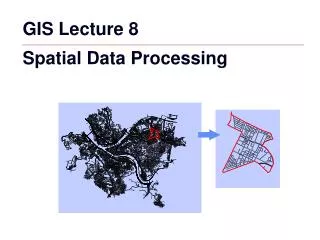
What is GIS used for? Understand WHERE things are Understand QUANTITIES Understand DENSITIES Find what’s INSIDE Find what’s NEARBY Understand CHANGE GIS is part of the process not merely the end result – “a pretty map”
Examples of Outputs Siân E. Rees, Martin J. Attrill, Melanie C. Austen, Stephen C. Mangi, Lynda D. Rodwell, A thematic cost-benefit analysis of a marine protected area, Journal of Environmental Management, Volume 114, 15 January 2013, Pages 476-485
Examples of Outputs Pascual,M; Borja,A; VandenEede,S; Deneudt,K; Vincx,M; Galparsoro,I; Legorburu,I; 2011. Marine biological valuation mapping of the Basque continental shelf (Bay of Biscay), within the context of marine spatial planning, Estuarine, Coastal and Shelf Science, Volume 95, Issue 1, Pages 186-198
Examples of Outputs Kevin St. Martin, Madeleine Hall-Arber, The missing layer: Geo-technologies, communities, and implications for marine spatial planning, Marine Policy, Volume 32, Issue 5, September 2008, Pages 779-786.
Examples of Outputs Erik Nelson, et al. 2009. Modelling multiple ecosystem services, biodiversity conservation, commodity production, and trade-offs at landscape scales. Frontiers in Ecology and the Environment7: 4–11
Examples of Outputs Potts et al (current) Marine Protected Areas and Ecosystem Services - Linking Conservation and Human Welfare? VNN Case Study Report.
Examples of Outputs Visualising sensitivity Example: Fin fish farm and habitats vulnerable to water flow rate
In Summary We can map the marine environment in a variety of ways We can understand confidence & effort We can look at change through time and under different scenarios Build a picture of sensitivity and vulnerability