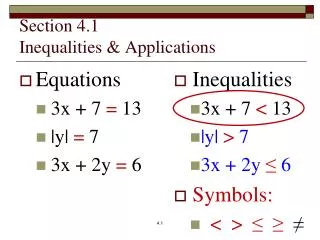
Section 7 – 5 Graphing Linear Inequalities
Section 7 – 5 Graphing Linear Inequalities. Objectives: To graph inequalities To write and use linear inequalities when modeling real-world situations. Linear Inequality :. An inequality containing two variables, that describes a region of the coordinate plane that has a boundary line.

Section 7 – 5 Graphing Linear Inequalities
E N D
Presentation Transcript
Section 7 – 5Graphing Linear Inequalities Objectives: To graph inequalities To write and use linear inequalities when modeling real-world situations
Linear Inequality: An inequality containing two variables, that describes a region of the coordinate plane that has a boundary line. Solution of a Linear Inequality: The coordinate of the points that make the inequality true.
HELPFUL HINTS WHEN GRAPHING LINEAR INEQUALITIES: • Write the equation in slope-intercept form (y=mx+b) • Graph the inequality as if it was an equation in slope-intercept form. • Use a dotted line for < or >, Use a solid line for ≤ or ≥ • Shade on top for > or ≥ • Shade on bottom for < or ≤. • Check your work by choosing a point in the shaded region, if the statement is true when you simplify, you shaded the correct way!
Example 1 Graphing an Inequality A) Graph y < 2x + 3.
Example 2 Rewriting to Graph an Inequality A) Graph 3x – 5y ≤ 10.
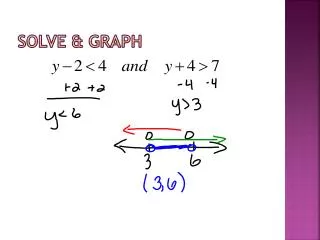
Example 3 Horizontal & Vertical Lines A) Graph y < 3 B) Graph x ≤ 2
Section 7 – 5Continued… Objectives: To write and use linear inequalities when modeling real-world situations
WARM UP For each linear inequality, decide where you would shade. • y < 4x – 2 • 2x – 4y ≤ 8 • Write the inequality for the graph. • Jan’s Graph of the inequality 4x + 6y > 12 is shown below. What is wrong with the graph?
Example 3 Horizontal & Vertical Lines A) Graph y < 3 B) Graph x ≤ 2
Example 4 Real-World Problem Solving A) Suppose your budget for a party allows you to spend no more than $12 on peanuts and cashews. Peanuts cost $2/lb and cashews cost $4/lb. Find three possible combinations of peanuts and cashews you can buy.
B) Suppose you plan to spend no more than $24 on a meat cookout. At your local market, hamburger costs $3.00/lb and chicken wings cost $2.40/lb. Find three possible combinations of hamburger and chicken wings you can buy.
C) Suppose your budget for the Freshman Dance allows you to spend no more than $24 for decorations for a party. Streamers cost $2 a roll and tablecloths cost $6 each. Find three possible combinations of streamers and tablecloths you can buy.