Download
1 / 2
20 likes | 199 Vues
counts. 1500. 1400. 1300. 1200. 1100. Between Fragments. 1000. 900. 800. 700. 600. 500. 400. 300. 200. 100. 0. 0.00. 0.05. 0.10. 0.15. 0.20. 0.25. 0.30. 0.35. 0.40. 0.45. 0.50. 0.55. 0.60. 0.65. 0.70. 0.75. 0.80. 0.85. 0.90. 0.95. 1.00. r 2. counts. 400.

E N D
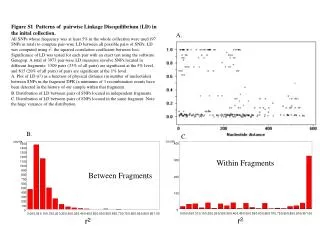
counts 1500 1400 1300 1200 1100 Between Fragments 1000 900 800 700 600 500 400 300 200 100 0 0.00 0.05 0.10 0.15 0.20 0.25 0.30 0.35 0.40 0.45 0.50 0.55 0.60 0.65 0.70 0.75 0.80 0.85 0.90 0.95 1.00 r2 counts 400 Within Fragments 300 200 100 0 0.00 0.05 0.10 0.15 0.20 0.25 0.30 0.35 0.40 0.45 0.50 0.55 0.60 0.65 0.70 0.75 0.80 0.85 0.90 0.95 1.00 r2 Figure S1 Patterns of pairwise Linkage Disequilibrium (LD) in the inital collection. All SNPs whose frequency was at least 5% in the whole collection were used (97 SNPs in total) to compute pair-wise LD between all possible pairs of SNPs. LD was computed using r2, the squared correlation coefficient between loci. Significance of LD was tested for each pair with an exact test using the software Genepop. A total of 3973 pair-wise LD measures involve SNPs located in different fragments: 1309 pairs (33% of all pairs) are significant at the 5% level, and 815 (20% of all pairs) of pairs are significant at the 1% level. A. Plot of LD (r2) as a function of physical distance (in number of nucleotides) between SNPs in the fragment DFR (a minimum of 3 recombination events have been detected in the history of our sample within that fragment). B. Distribution of LD between pairs of SNPs located in independent fragments. C. Distribution of LD between pairs of SNPs located in the same fragment. Note the huge variance of the distribution. A. B. C.