Download
1 / 30
300 likes | 442 Vues
Electron Cloud Simulations with 75ns Bunch Spacing. Ubaldo Iriso. CELLS-ALBA Ctra BP-1413, Km 3.3 Cerdanyola, 08193 (Barcelona) Spain. With the help and support from AB Group at CERN, G. Arduini, O. Dominguez, K. Li, H. Maury, E. Metral, G. Rumolo, and F. Zimmermann. Introduction.

E N D
Electron Cloud Simulations with 75ns Bunch Spacing Ubaldo Iriso CELLS-ALBA Ctra BP-1413, Km 3.3 Cerdanyola, 08193 (Barcelona) Spain With the help and support from AB Group at CERN, G. Arduini, O. Dominguez, K. Li, H. Maury, E. Metral, G. Rumolo, and F. Zimmermann
Introduction • OBSERVATIONS IN 2010: Pressure rises with 75ns bunch spacing were observed in IR3 Even though P~10^-6mbar, 936 bunches could be filled in • PLAN FOR 2011: Scrubbing using 50ns bunch trains Physics operation using 75ns • GOAL: Investigate SEY parameters such that e-clouds do not limit physics operation
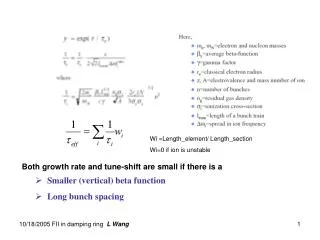
Introduction LIMIT: r <1e11e-/m^3** @IR3 (most critical warm location) @dipoles (~70% of LHC) (**limit for beam instabilities – see K. Li presentation) • Nominal LHC beam parameters & scan SEY parameters (SEY & R) to find r_limit … previously, some scan with beam pipe radius and pressure tests…
Simulations scanning initial pressure INITIAL PRESSUREs: 32, 320, 960, and 3200nTorr (FIELD FREE REGIONS) • With larger pressures, we reach the saturated value faster (but the saturated value does not change) • The pressure does not affect the e-energy spectrum In general, we use 320nTorr (However, we sometimes increase this pressure for CPU purposes)
Simulations at IR3 ECLOUD simulations main input parameters
Simulations at IR3 Example of the linear e-density for R=0.5 and SEY = [2.1 ... 2.7 ] The limit r <1e11e-/m^3 refers to e-density before the bunch arrives For all simulations, we take the value before the last bunch arrives at the end of the 4th batch.
Simulations at Dipoles • In this case, due care shall be taken in the “slicing” • The ECLOUD slices shall properly sample the e- oscillations in presence of a magnetic field TLarmor = 2*pi*me / (e*B) • Ideally, the sampling should be ~8 samples/osc. • But CPU time and huge output files are a big limitation, so we stayed between 3-4 (note also that Larmor radius decreases with B).
Simulations at Dipoles Electron motion in a dipole
Simulations at Dipoles Electron motion in a dipole
Simulations at Dipoles, Injection ECLOUD simulations main input parameters
Simulations at Dipoles, Injection We follow the same procedure as in IR3 to get e-densities at last bunch passage in the 4th batch
Simulations at Dipoles, Injection …and so we get a similar plot, but with higher thresholds wrt IR3. Presumably, due to smaller apertures (30mm vs (22,18)mm) – see next Note that for R=0.3, SEY thresholds > 2.7, which is unrealistically high
Simulations scanning chamber aperture Comparison between the beam screen geometry (a=22; b=18mm) with a round chamber of different beam pipe radius (from 20 to 35mm) • Larger beam pipe radius results in a longer survival of low energy electrons • So, IR3 (30mm) should have lower threshold than Beam Screen TOF of an e- at energy E in a chamber of radius=b (neglecting external electric fields)
Simulations at Dipoles, Injection …but that’s not all… In Dipole regions, e- distribution is important because of the scrubbing In these simulations, we assumed that primary e- are created by gas ionization 90% within the beam core and 10% outside beam core.
Simulations at Dipoles, Injection …and an interesting situation at the energy spectrum… • The energy spectrum between (400-600)eV shows: • hump when e-clouds occur • dip when e-clouds no occur Does the hump corresponds to the presence of the stripes?
Simulations at Dipoles, Store ECLOUD simulations main input parameters Few parameters changed wrt to dipoles @injection 64bchs (only 2 batches) @store 25000 @store 1.39 @store 0.238 @store 960nTorr @store
Simulations at Dipoles, Store We follow the same procedure as in IR3 to get e-densities at last bunch passage in the 2nd batch
Simulations at Dipoles, Store e- density is larger than at injection, but thresholds are roughly the same Due to smaller beam size? Sigma_x,y=(1.51, 0.658) @injection Sigma_x,y=(1.39, 0.236) @store
Simulations at Dipoles, Store Hor flux Distribution: stripes are located at similar places wrt to injection conditions The hump is also there However, recall these simulations have different pressures and only two batches
Dipoles @Store: icoll=0 vs icoll=2 Typically, ECLOUD simulations assume primary electrons from: gas ionization at injection (at 450GeV, Ec = 0.01eV) synchrotron radiation at designed store (at 7TeV, Ec=45eV) At 2011 store (3.5TeV), critical energy = 5.4eV, for which Y*~0.02: (J. Gomez-Goni, ASEVA Summer School 1999)
Simulations at Dipoles, Store Comparison between primary e- assumed by: • gas ionization (icoll=2) • synchrotron radiation (icoll=0, with peeff=0.0016) e-line density: Heat Load:
Simulations at Dipoles, Store Hor flux: Energy spectrum: The stripes with sync radiation are less clear (see next) The hump disappears when primary e- are generated by sync. radiation
Simulations at Dipoles, Store Icoll=2 – Gas ionization Icoll=0 – Synchrotron Radiation Scrubbing at injection conditions will be efficient for store conditions?
Conclusions • SEY thresholds for 75ns bunch spacing were found for feel free regions and dipole at injection and store conditions: • Larger thresholds at dipoles than IR3 (presumably due to smaller apertures) • Dipole simulations show a hump in the energy spectrum between (400-600) eV, not clear whether these corresponds to the presence of stripes
Conclusions • Horizontal distribution at dipoles are similar at injection and store, provided that in both cases primary e- are due to gas ionization. • However, using sync rad as primary source show a different electron distribution in the vacuum chamber. This points out that e-cloud at injection and 50ns might scrub diffs. regions inside the vacuum chamber. Acknowledgements • I wish to thank • all ABP Section for their invitation to participate in the Workshop and the EuCard/ACCNET for their support • D. Einfeld and F. Perez (CELLS) for their comprehension
Slices during bunch passage shall be enough to follow e- oscillations inside bunch: