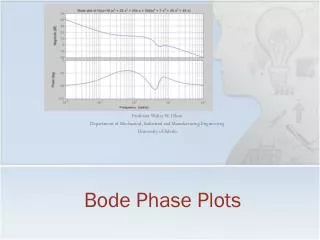
Bode Phase Plots
Bode Phase Plots. Professor Walter W. Olson Department of Mechanical, Industrial and Manufacturing Engineering University of Toledo. Outline of Today’s Lecture. Review Frequency Response Reading the Bode Plot Computing Logarithms of |G(s)| Bode Magnitude Plot Construction Phase

Bode Phase Plots
E N D
Presentation Transcript
Bode Phase Plots Professor Walter W. Olson Department of Mechanical, Industrial and Manufacturing Engineering University of Toledo
Outline of Today’s Lecture • Review • Frequency Response • Reading the Bode Plot • Computing Logarithms of |G(s)| • Bode Magnitude Plot Construction • Phase • Phase Computations • Full Bode Plot • System Identification • Using Bode Plots for System Identification
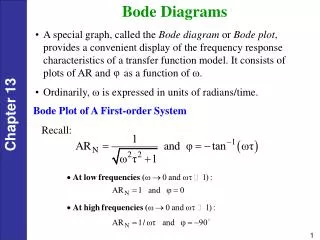
Frequency Response General form of linear time invariant (LTI) system was previously expressed as We now want to examine the case where the input is sinusoidal. The response of the system is termed its frequency response.
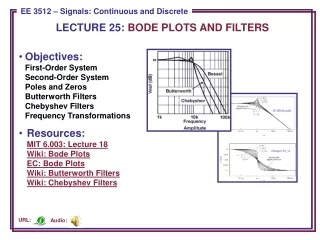
Reading the Bode Plot Amplifies Attenuates Input Response The magnitude is in decibels decade also, cycle Note: The scale for w is logarithmic
What is a decibel? • The decibel (dB) is a logarithmic unit that indicates the ratio of a physical quantity relative to a specified or implied reference level. A ratio in decibels is ten times the logarithm to base 10 of the ratio of two power quantities. (IEEE Standard 100 Dictionary of IEEE Standards Terms, Seventh Edition, The Institute of Electrical and Electronics Engineering, New York, 2000; ISBN 0-7381-2601-2; page 288) Because decibels is traditionally used measure of power, the decibel value of a magnitude, M, is expressed as 20 Log10(M) • 20 Log10(1)=0 … implies there is neither amplification or attenuation • 20 Log10(100)= 40 decibels … implies that the signal has been amplified 100 times from its original value • 20 Log10(0.01)= -40 decibels … implies that the signal has been attenuated to 1/100 of its original value
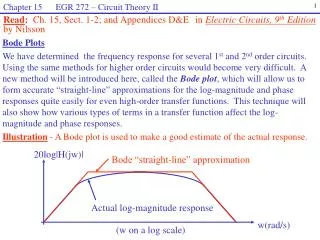
Computing Logarithms of G(s) Since this does not vary with the frequency it a constant that will be added to all of the other factors when combined and has the effect of moving the complete plot up or down When this is plotted on a semilog graph (w the abscissa) this is a straight line with a slope of 20p (p is negative if the sp term is in the denominator of G(s)) … without out any other terms it would pass through the point (w,MdB) = (1,0)
Computing Logarithms of G(s) a is called the break frequency for this factor For frequencies of less than arad/sec, this is plotted as a horizontal line at the level of 20Log10 a, For frequencies greater than arad/sec, this is plotted as a line with a slope of ± 20 dB/decade, the sign determined by position in G(s)
Computing Logarithms of G(s) wn is called the break frequency for this factor For frequencies of less than wnrad/sec, this is plotted as a horizontal line at the level of 40Log10wn, For frequencies greater than wnrad/sec, this is plotted as a line with a slope of ± 40 dB/decade, the sign determined by position in G(s)
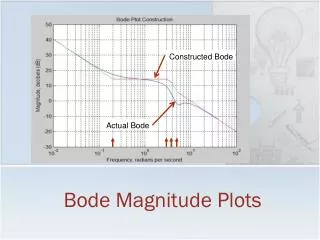
Bode Plot Construction • When constructing Bode plots, there is no need to draw the curves for each factor: this was done to show you where the parts came from. • The best way to construct a Bode plot is to first make a table of the critical frequencies and record that action to be taken at that frequency. • You want to start at least one decade below the smallest break frequency and end at least one decade above the last break frequency. This will determine how semilog cycles you will need for the graph paper. • This will be shown by the following example.
Example • Plot the Bode magnitude plot of
Example Constructed Bode Actual Bode
Phase • For a sinusoidal input, phase represents the lag of the system or, alternatively, the processing time of the system to produce an output from the input • Phase is measured as an angle • A cycle of the input is consider to take 2p radians or 360 degrees • Phase is the angular distance it takes for the output to represent the input • Thus it is normal that as the frequency increases that the phase also increase • In the case where the phase exceeds 180 degrees, the output appears to “lead” the input. This is particularly evident in the range of 270 to 360 degrees.
Phase • As with magnitude there are 4 factors to consider which can be added together for the total phase angle. • We will consider, in turn, • The sign will be positive if the factor is in the numerator and negative if the factor is in the denominator
Example • Plot the Bode Phase Plot for
Example • Plot the Bode Phase Plot for • Again a table is useful:
Example Asymptotic Bode Phase Actual Bode Phase
Full Bode Plot Constructed Bode Asymptotic Bode Phase Actual Bode Actual Bode Phase
System Identification • It is not unusual for a field engineer to be shown a piece of equipment and then asked if he can put a control system on it or replace the control system for which there are no parts. • The task of determining how an unknown structure responds is called “System Identification”. • To identify a system, there are many tools are your disposal • First and foremost, what should the system structure look like? • Motors are often first order transfer functions ( ) which you then attempt to identify the constants • Perform step tests and see what the response looks like • Perform tests with sinusoidal outputs and use the Bode plot to identify the system • Apply statistical/time series methods such as ARMAX and RELS
Using Bode Plots forSystem Identification • The overall order of the system will be the high frequency phase divided by 90 degrees • The exponent of the “s” term will be the slope on the magnitude plot at the lowest frequency divided by 20 • Alternatively, the exponent of “s” is the lowest frequency phase divided by 90 degrees. • The system gain constant (Kt) in dB will be the height value at the extension of the “s” term line on the magnitude plot to where it crosses1 rps • Starting from the left (the lowest frequency) on the magnitude plot, determine the structural components using the change in slopes in increments of 20 degrees either up or down • Then by using the intersection of the lines at those places match to the test curve, determine the break frequencies • Write the transfer function in the form
Example -40 dB/dec Kt=35 dB -60 dB/dec -40 dB/dec -80 dB/dec -40 dB/dec 20 0.52 2.2 4 exp of s = -2 overall order =3
Example -40 dB/dec Kt=35 dB -60 dB/dec -40 dB/dec -80 dB/dec -40 dB/dec 20 0.52 2.2 4 exp of s = -2 overall order =-3
Example -40 dB/dec Kt=35 dB -60 dB/dec -40 dB/dec -80 dB/dec -60 dB/dec -40 dB/dec 20 0.52 2.2 4 exp of s = -2 overall order =-3
Summary • Phase • For a sinusoidal input, phase represents the lag of the system or, alternatively, the processing time of the system to produce an output from the input • Phase Computations • Full Bode Plot • System Identification • The task of determining how an unknown structure responds is called “System Identification”. • Using Bode Plots for System Identification Next Class: Laplace Transforms