Download
1 / 19
190 likes | 347 Vues
Session 26 Modeling the Static View: The Deployment Diagram. Written by Thomas A. Pender Published by Wiley Publishing, Inc. October 27, 2011 Presented by Hyewon Lim. Contents. Describing the Purpose and Function of the Deployment Diagram Defining the Notation for the Deployment Diagram

E N D
Session 26Modeling the Static View:The Deployment Diagram Written by Thomas A. Pender Published by Wiley Publishing, Inc. October 27, 2011 Presented by Hyewon Lim
Contents • Describing the Purpose and Function of the Deployment Diagram • Defining the Notation for the Deployment Diagram • Mapping Software Components to an Architecture • Applying the Combined Diagrams to the Case Study
Describing the Purpose and Function of the Deployment Diagram (1/2) • Deployment diagram • Model the physical architecture of hardware • Describes the physical resources • C.f., A class diagram describes logical resources • Node • A physical object that represents a processing resource • Contains, or is responsible for, one or more software components or objects • Can communicate across the physical associations between the nodes
Describing the Purpose and Function of the Deployment Diagram (2/2) • Purpose of a Deployment diagram • Present a static view, or snapshot, of the implementation environment • A complete description of the system will contain a number of different Deployment diagrams • Each focused on a different aspect of the system management • i.e., • One might focus on how software components are distributed • Another might model how the executable is loaded from one node to another node where it actually runs • For a multi-tiered application, • Model the distribution of the application layers their physical connections, andtheir logical paths of communication
Contents • Describing the Purpose and Function of the Deployment Diagram • Defining the Notation for the Deployment Diagram • Mapping Software Components to an Architecture • Applying the Combined Diagrams to the Case Study
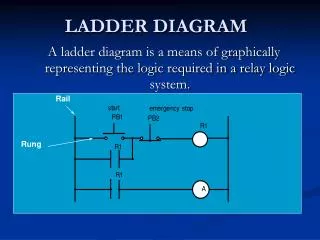
Defining the Notation for the Deployment Diagram (1/2) • The Deployment diagram has two types of elements • Nodes (resources) and associations (connections) • Node icon is drawn as a 3D box • Physical association is represented as a solid line • “connects to” or use stereotypes • Use multiplicity to define the number of nodes on each end of the associations
Defining the Notation for the Deployment Diagram (2/2) • An object-level view of a Deployment diagram • Can function like network diagrams • Can function as a requirements specification for each node
Contents • Describing the Purpose and Function of the Deployment Diagram • Defining the Notation for the Deployment Diagram • Mapping Software Components to an Architecture • Applying the Combined Diagrams to the Case Study
Mapping Software Components to an Architecture • Combine the two physical diagram notations • More common technique
Contents • Describing the Purpose and Function of the Deployment Diagram • Defining the Notation for the Deployment Diagram • Mapping Software Components to an Architecture • Applying the Combined Diagrams to the Case Study
Applying the Combined Diagrams to the Case Study(1/8) • Build the combined Deployment and Component diagram • The h/w architecture consists of three kinds of devices
Applying the Combined Diagrams to the Case Study(2/8) • Build the combined Deployment and Component diagram • Each client PC runs a client UI for receiving
Applying the Combined Diagrams to the Case Study(3/8) • Build the combined Deployment and Component diagram • The client-server nodes and server-DB servers are associated using an Ethernet connection
Applying the Combined Diagrams to the Case Study(4/8) • Build the combined Deployment and Component diagram • The server application uses three resources
Applying the Combined Diagrams to the Case Study(5/8) • Build the combined Deployment and Component diagram • The DB server runs the DBMS and the DB
Applying the Combined Diagrams to the Case Study(6/8) • Build the combined Deployment and Component diagram • Show the fact that the UI component needs help from the server-side application • Draw a dashed dependency arrow
Applying the Combined Diagrams to the Case Study(7/8) • Build the combined Deployment and Component diagram • Show the fact that the server dbaccess component needs help from the dbms on the DB server • Draw a dashed dependency arrow
Applying the Combined Diagrams to the Case Study(8/8) • Build the combined Deployment and Component diagram • The completed Deployment diagram