Download
1 / 10
100 likes | 238 Vues
This overview explores the concepts of population dispersion and growth, illustrating three types of survivorship curves—Type I (few offspring, high parental care), Type II (equal survival chances), and Type III (high infant mortality, no parental care). It discusses factors influencing population size, including immigration and emigration, births, and deaths. The text also contrasts exponential growth, characterized by abundant resources and minimal competition, with logistic growth, where limitations arise due to competition, predation, and disease. An analysis of human population growth trends is included.

E N D
Survivorship Curves • Type I • Few offspring • Low infant mortality • Parental care of young • Most survive until old age • Large mammals, including humans
Survivorship Curves • Type II • Equal chance of living or dying throughout the lifetime • Birds, reptiles, small mammals
Survivorship Curves • Type III • High infant mortality rate • Many offspring • No parental care • Invertebrates, fish, amphibians, and plants
Changes in Population Size • Growth factors • Immigration: individuals moving into a population • Births • Shrinking factors • Emigration: individuals moving out of a population • Deaths
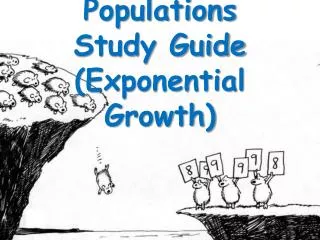
Exponential Growth • Early phase of growth • High availability of resources • Little competition • Little predation
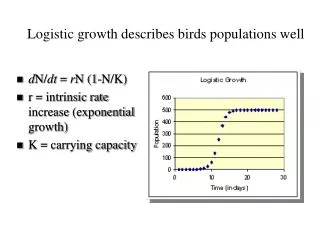
Logistic Growth • Limits on growth appear • Competition for resources • Predation • Parasitism • Illness
Human Population Growth Are humans in exponential or logistic growth?
U.S. Population Density - 2000 People per square mile 0-1 (white) 10-24 (green) 100-249 (blue) 1-4 (yellow) 25-49 (teal) 250-66,995 (dark blue) 5-9 (yellow-green) 50-99 (dark teal)