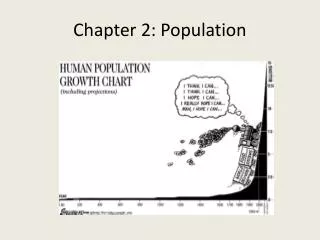
What is a population?
Within a given area where the scale of the area is study-dependent. What is a population?. Localised group of individuals of the same species. e.g. population of aphids on a leaf. e.g. population of baboons on the Cape Peninsula.

What is a population?
E N D
Presentation Transcript
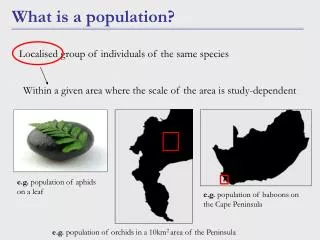
Within a given area where the scale of the area is study-dependent What is a population? Localised group of individuals of the same species e.g. population of aphids on a leaf e.g. population of baboons on the Cape Peninsula e.g. population of orchids in a 10km2 area of the Peninsula
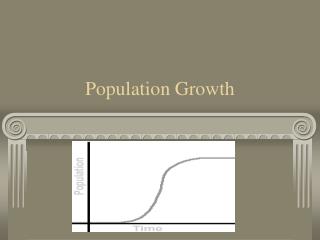
250 200 150 Population size 100 50 0 Year 1 Year 2 Year 3 Year 4 Year 5 Year 6 Year 7 Year 8 Year 9 Year 10 Year 11 Year 12 Time (t) Death Emigration Birth Mortality Extrinsic Environment Weather Population Biology Describe Explain (Influencing factors) Intrinsic
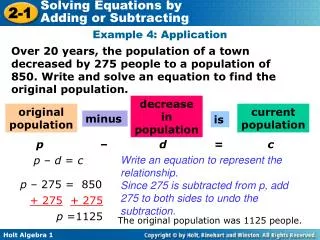
Dependent on organisms life cycle • Overlapping and non-overlapping Original population Population growth = + + Immigration - Death - Emigration Birth Nt+1 = Nt + B + I – D - E Quantifying population growth N = population size t = time period (eg. Days, months, years…depends on study organism) Populations grow IF (B + I) > (D + E) Populations shrink IF (D + E) > (B + I)
Non-overlapping (discrete) generations Overlapping generations Life cycles Population growth potential
www.kidfish.bc.ca/caddis_cycle.htm Life cycles – discrete generations Often seasonally determined Pods Adults1 Generation 1 Eggs Instar I Replace Instar II Instar III Adults2 Generation 2 Instar IV
R1 R1 R1 Time 1 R1 R1 R1 Differential survival Differential reproduction R2 R2 R2 Time 2 R2 R2 R2 R3 R3 R3 R1 R1 R1 R3 R3 R3 Time 3 Life cycles – overlapping generations Individuals of different ages reproducing at the same time
Overlapping generations Frequency of reproduction Semelparous Iteroparous Life cycles Non-overlapping generations Population growth potential
Single Reproductive Event SEMELPAROUS: only one reproductive event in their lifetime E.g. most invertebrates One individual Growth phase Reproductive phase Post-Reproductive phase Multiple Reproductive Events Year 1 ITEROPAROUS: multiple reproductive events over extended portions of their lives E.g. most birds & mammals Growth phase Reproductive phase Post-Reproductive phase One individual Semelparous vs Iteroparous Life Cycles Year 2 Year 1 Year 3 Year 4
Dependent on organisms life cycle: Generation overlap & Semel/Iteroparous Age and stage specific Original population Population growth = + + Immigration - Death - Emigration Birth Quantifying population growth Differential reproduction Differential survival
Pods Adults M F 7.3 11 Eggs Adults Nt 0.079 Seeds Nt.f Instar I P=0 0.72 Instar II 0.78 Seedlings Nt.f.g Instar III Adults Nt+1 Adults M F 0.76 0.69 Instar IV Fecundity (f) Different ages and stage classes have different probabilities of survival and different probabilities of successful reproduction BIRTH SURVIVAL Germinate (g) Survival (p) Survival to maturity (s) Nt+1 = (Nt.p) + (Nt.f.g.s)
Original population Population growth = + + Immigration - Death - Emigration Birth Tool for quantifying population growth Quantifying population growth Dependent on organisms life cycle: Generation overlap & Semel/Iteroparous Age and stage specific Differential reproduction Differential survival
Original population Population growth = + + Immigration - Death - Emigration Birth Length of each generation Number of young produced in each reproductive event Quantifying population growth LIFE TABLES a simple method for keeping track of births, deaths, and reproductive output in a population of interest Frequency of reproductive events
COHORT LIFE TABLE Snapshot in time N of Age 1 Used to estimate population growth N of Age 2 N of Age 3 Life tables 2 ways of constructing Life tables STATIC LIFE TABLE compares population size from different cohorts, across the entire range of ages, at a single point in time Time 1
Cohort 1 Cohort 2 lx lx Population size (n) Cohort 4 Cohort 3 lx lx Static Life Tables • Static tables make two important assumptions: • the population has a stable age structure (i.e. the proportion of individuals in each age class does not change from generation to generation) • the population size is stationary , or nearly stationary
COHORT LIFE TABLE follows a group of same-aged individuals from birth (or fertilized eggs) throughout their lives Less accurate than cohort tables Time (t) Considers differential probabilities at each life stage Age 1birth Age 1death Life tables 2 ways of constructing Life tables STATIC LIFE TABLE compares population size from different cohorts, across the entire range of ages, at a single point in time Note: For organisms that have separate sexes, life tables frequently follow only female individuals.
annual life cycle • Semelparous (only one breeding season in its life time) • no overlap of generations Animal with To make a life table for this simple life history, we need only count (or estimate) the population size at each life history stageand the number of eggs produced by the adults. Cohort Life Tables Simplest form: www.kidfish.bc.ca/caddis_cycle.htm
Age classification Cohort Life Tables From this raw data we can calculate several LIFE HISTORY FEATURES One generation COUNT DATA
Age classification Proportion of original cohort surviving to each stage lx Calculate by: divide the number of individuals living at the beginning of each age (ax) by the initial number of eggs(a0) Cohort Life Tables Calculated life history features This data is STANDARDIZED therefore comparable between populations ...Raw data is NOT COUNT DATA
Age classification Calculate by: lx - lx+1 ADVANTAGE: Proportions can be added together to get a measure of mortalityfor different stage groups Cohort Life Tables Calculated life history features Proportion of original cohort surviving to each stage lx DISADVANTAGE: > ax = > lx and dx values ; Therefore dxdoes not indicate the stage where mortality is most INTENSE COUNT DATA
Age classification CANNOT ∑ Cohort Life Tables Calculated life history features Proportion of original cohort surviving to each stage lx qx is the fraction of the population dying at each stage ADVANTAGE: qxdoesindicate the stage where mortality is most INTENSE Calculate by: dx/lx Stage specific DISADVANTAGE: COUNT DATA
log p age specific survivorship, calculated as 1 - qx (or ax+1 / ax): cannot be summed Cohort Life Tables Combining advantages of dx (can be summed) and qx (indicates mortality intensity) is K (killing power) K
Age classification Proportion of original cohort surviving to each stage lx Cohort Life Tables Assessing the populations reproductive output Calculated life history features Age specific COUNT DATA COUNT DATA
Age classification Proportion of original cohort surviving to each stage lx Cohort Life Tables Assessing the populations reproductive output Calculated life history features Age specific mx is the eggs produced per surviving individual at each age or individual fecundity Calculate by: Fx/ax COUNT DATA COUNT DATA
Age classification Proportion of original cohort surviving to each stage lx Cohort Life Tables Assessing the populations reproductive output Calculated life history features Age specific The number eggs produced per original individual at each age (lxmx) Calculate by: lx*mx COUNT DATA COUNT DATA
R0 is the population’s replacement rate: If R0 = 1.0…no population growth If R0 < 1.0…the population is declining If R0 > 1.0…the population is increasing Age classification Proportion of original cohort surviving to each stage lx Cohort Life Tables Assessing the populations reproductive output Calculated life history features Age specific lxmxis an important value to consider in population studies ∑ lxmx = R0 basic reproductive rate individuals produced for every individual in every generation If only females in the life table then: individuals produced for every female in every generation COUNT DATA COUNT DATA
Raw count data Raw count data Reproductive output Life history features ∑ lxmx Calculating population features from life tables • R0 –the basic reproductive rate • Tc = cohort generation time • ex = life expectancy • r = intrinsic growth rate Can use life tables to determine characteristics about the population:
semelparous annual life cycle (Tc =1 year) 1872.03 610.32 Cohort generation time (Tc) Cohort generation time (Tc)can be defined as the average length of time between when an individual is born and the birth of its offspring. Tc is quite easy to obtain from our first example… But Tc is less obvious for more complex life cycles – must be calculated Generation time BIRTH OFFSPRING DEATH • Calculate Tc: • Calculate the length of time to offspring production for each age class • Add all the lengths of time to offspring production for the entire cohort • Calculate the total offspring produced by the survivors • Divide bylengths of time to offspring production/the total offspring produced by the survivors Tc = 3.1 TOTAL
Raw count data Raw count data Reproductive output Life history features Calculating population features from life tables • R0 –the basic reproductive rate • Tc = cohort generation time • ex = life expectancy • r = intrinsic growth rate Can use life tables to determine characteristics about the population:
Life expectancy (ex) Life expectancy = the probability of living ‘x’ amount of time beyond a given age. Most commonly quoted as the life expectancy at birth, e.g., life expectancy for South Africans females = 50 yrs, and for South African males = 55 years (http://www.who.int/countries/zaf/en/) Note: time unit depends on organims being studied) We can also calculate the mean length of life beyond any given age for the population. Time still to live (probability) Age 1 Death Time still to live Any Age Age 2 Time still to live (probability) Death Death Time still to live Age 3 Death
Life expectancy (ex) Calculating ex: • Calculate Lx - number of surviving individuals in consecutive stage/age classes • Calculate Tx - the total number of living individuals at age ‘x’ • Calculate ex NB. Units of e must be the same as those of x Thus if x is measured in intervals of 3 months, then ex must be multiplied by 3 to give life expectancy in terms of months
Non-overlapping generations Overlapping generations Calculating population features from life tables • R0 –the basic reproductive rate • Tc = cohort generation time • ex = life expectancy • r = intrinsic growth rate Can use life tables to determine characteristics about the population: HOW??
1 generation N0 NT = ∑ lxmx Basic reproductive rate (R0) If R0 remains constant from generation to generation, then we can also use it to predict population size several generations into the future. R0 considers birth of new individuals N0 N1 N2 N3 Nn Constant R0 1 generation 2 generations 3 generations n generations Intrinsic growth rate (r) Non-Overlapping generations R0 converts the initial population size (N0) to the new size one generation later (NT) NT=N0.R0
Nt = 10 Nt+1 = 20 Rearrange As for R0 If R= 1.0…no population growth If R < 1.0…the population is declining If R > 1.0…the population is increasing Intrinsic growth rate (r) Overlapping generations Fundamental Reproductive Rate (R) Consider birth of new individuals + survival of existing individuals R=20/10 R=2 Population size at t+1 = N0.R N1 = N0.R1 Nt = N0.Rt Population size at t+2 = N0.R.R N2 = N0.R2 Population size at t+3 = N0.R.R.R N3 = N0.R3
NT = N0.RT IF t = T, then Intrinsic growth rate (r) Overlapping generations Non-Overlapping generations NT=N0.R0 Combine Nt = N0.Rt R0 = RT lnR0 = T.lnR lnR0/T = lnR But lnR = r Can now link R0 and R Used to project population growth in population models r = average rate of increase/individual takes generation time into account
COHORT LIFE TABLE follows a group of same-aged individuals from birth (or fertilized eggs) throughout their lives STATIC LIFE TABLES is made from mortality data collected from a specified time period Problems: Life tables 2 ways of constructing Life tables • Most organisms have complex life histories (overlapping generations) • Not always possible or feasible to follow a single cohort from birth to death
Finite SURVIVAL rates e.g. convert annual survival (p) = 0.5, to monthly survival: Adjusted = Observed ts/to = 0.5 1/12 = 0.5 0.083 = 0.944 e.g. convert daily survival (p) = 0.99, to annual survival = 0.99 365 = 0.0255 Adjusted = Observed ts/to = 0.99 365/1 Finite and instantaneous rates The values of p, q hitherto collected are FINITE rates…their units of time = units of time for x (months, days, three-months etc) They have limited value in comparisons unless same units used To convert FINITE rates at one scale to (adjusted) finite rates at another: [Adjusted FINITE] = [Observed FINITE] ts/to ts = Standardised time interval (e.g. 30 days, 1 day, 365 days, 12 months etc) to = Observed time interval
Finiteand instantaneous rates INSTANTANEOUS MORTALITY rates = Loge (FINITE SURVIVAL rates) ALWAYS negative Finite Mortality Rate = 1 – Finite Survival rate Finite Mortality Rate = 1.0 – e Instantaneous Mortality Rate MUST SPECIFY TIME UNITS