Chapter 2: Population
Chapter 2: Population. Key Questions/Big Ideas. Where is the world’s population distributed? Where has the world’s population increased? Why is population increasing at different rates in different countries? What tools do demographers use to study population?.

Chapter 2: Population
E N D
Presentation Transcript
Key Questions/Big Ideas • Where is the world’s population distributed? • Where has the world’s population increased? • Why is population increasing at different rates in different countries? • What tools do demographers use to study population?
Ecumene: the portion of the earth occupied by permanent human settlement. Geographia, Claudius Ptolemy (83 – 161AD) Source: wikipedia
Where is human population concentrated? • http://www.worldmapper.org/animations/wm01to02.html • Two thirds of world population lives in 4 regions: • East Asia • South Asia • Southeast Asia • Europe
Interactive population map • http://www.worldmapper.org/svg/map2/index.html
Density • Arithmetic • Physiological • Agricultural
Arithmetic Density • The total number of people divided by the total land area
Physiological Density • The ratio of the number of people supported per unit area of arable land (land suitable for farming)
Agricultural Density • The ratio of the number of farmers to the total amount of arable land
What do these densities tell us? • A high density does not necessarily mean that a country has a high population count. • If a country has a high physiological density then that means that the country has difficulty growing enough food.
What do these densities tell us? • A higher agricultural density suggests that the available agricultural land is being used by more and may reach its output limit sooner than a nation that has a lower agricultural density. • A country with a lower AgD may have more advanced farming techniques in place so that not as many people farm a large area of arable land using efficient machinery
Population Increase • Natural Increase • Fertility • Mortality
Natural Increase • Crude Birth Rate (CBR) 20 births per 100 people alive=20 • Crude Death Rate (CDR) 5 deaths for every 1000 people alive=5 NIR=CBR-CDR(converted to percentages) Ex. 2%-.5% = 1.5% Natural Increase Rate
Doubling time • How many years does it take to double the world’s population? • What factors does this figure depend on? • total population to start with • NIR
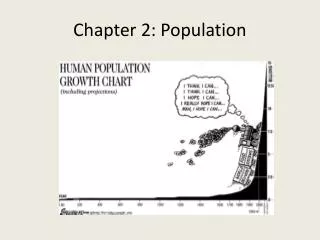
World Population Growth Over Time 1CE 1900CE
Fertility • Total Fertility Rate (TFR) is the average number of children a woman will have in her childbearing years (15-49) • How does TFR differ from CBR? • Attempts to predict the future behavior (and, by extension, population), whereas CBR gives a picture of society at that moment
Mortality • How long do people live? • What increases life expectancy for adults? • Why do babies and children die? • What is IMR? • Why is it higher in some places than others? • Why is it so high in the United States, relative to other MDCs?
Increasing Life Expectancy • "... adding person-years-of-life back into the life table is far easier to accomplish when it involves saving infants and children from dying of infectious diseases than ... saving people over the age of 70." S. Jay Olshansky, 2005
Percentage of Births Attended • http://www.globalhealthfacts.org/data/topic/map.aspx?ind=77
Connection: Fertility and Mortality "...how many of us realize that, in much of the world, the act of giving life to a child is still the biggest killer of women of child-bearing age?" LiyaKibede, 2005
Population Pyramids • What are they? • What can we use them for?
Population Pyramids: Definition • A display of a country’s population in groups of age and gender. • Normally shows the percentage of the total population in 5-year age groups, the youngest group being 0-4 years of age at the base of the pyramid and the oldest group near the top. • Shape of a pyramid is determined primarily by the CBR (Crude Birth Rate) over time in the community.
Some further definitions… • Sex Ratio: number of males per hundred females in the population is the sex ratio. • Dependency ratio: number of people who are too young or old to work, compared to those who are in their productive years.
How do we use Population Pyramids? • The age structure of a population is extremely important in understanding similarities and differences among countries. • Can help us see what stage of the demographic transition a given country is in http://en.wikipedia.org/wiki/Population_pyramid
The Demographic Transition • Stage 1: Low Growth • Stage 2: High Growth • Stage 3: Moderate Growth • Stage 4: Low Growth
Stage One: Low GrowthPre-modern • Balance between birth and death rates (both high) • Short life expectancy • Population growth slow (.05% TIR) • Doubling time 1-5,000 years (vs. 30-40 of late 20th century!) • Pattern broken in Western Europe in late 18th century
Stage Two: Rapid GrowthUrbanizing/Industrializing • Quickly rising population • Decline in death rate • Consistent food source (Agricultural Revolution of 18th century) • Improved health conditions (water supply, sewage, personal hygiene) • Birth rate remains high
Stage Three: Moderate GrowthMature Industrial • Birth rate declining • Low death rate; longer life expectancy • Immigration from less developed countries may account for much of the population growth in MDCs that are in Stage III • China, South Korea, and Cuba are quickly approaching Stage III • U.S. is in Stage III
Stage Four: Low Growth Post-Industrial • Low death rate • Low birth rate • Higher dependency ratio • Longer life expectancy • Germany, Denmark are examples
The Census Picture Source: blogs.villagevoice.com Picture Source: simple.wikipedia.org
Malthus’ Principle of Population • 1766-1834 • Political economist in England • Concerned by decline of living conditions caused by three things: • overproduction of the young (fertility) • Inability of resources to keep up with rising population • Irresponsibility of lower classes Source: UC Berkeley Museum of Paleontology;
Malthus’ theory of overpopulation • Poverty and famine are natural outcomes of population growth and insufficient food supply • If left unchecked (i.e. family size regulated), overpopulation will exhaust resources and famine will take over the world
Epidemiology • Epidemic • Pandemic
Epidemiologic transition • Stage 1 • Stage 2 • Stage 3 • Stage 4 • Stage 5?