CPU Function Trace Analysis and Kernel Stack Overview
This document details the analysis of CPU function traces and associated kernel stack activities. It focuses on a specific event identified by an ID and records various parameters related to CPU operations, including ticks, counts, and function calls. The recorded functions illustrate the interactions at the driver and kernel interface, providing insights into system performance and potential areas of optimization. Key functions like `ddi_get16`, `nge_check_copper`, and `av_dispatch_softvect` are discussed, showcasing their roles within the kernel's operation during the monitored period.

CPU Function Trace Analysis and Kernel Stack Overview
E N D
Presentation Transcript
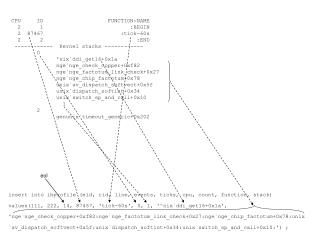
CPU ID FUNCTION:NAME 2 1 :BEGIN 2 87467 :tick-60s 2 2 :END ------------ Kernel stacks ------------ 0 'nix`ddi_get16+0x1a nge`nge_check_copper+0xf82 nge`nge_factotum_link_check+0x27 nge`nge_chip_factotum+0x78 unix`av_dispatch_softvect+0x5f unix`dispatch_softint+0x34 unix`switch_sp_and_call+0x10 1 2 genunix`timeout_generic+0x202 eol insert into ibprofile (eid, rid, line, events, ticks, cpu, count, function, stack) values(111, 222, 14, 87467, 'tick-60s', 0, 1, '^nix`ddi_get16+0x1a', 'nge`nge_check_copper+0xf82:nge`nge_factotum_link_check+0x27:nge`nge_chip_factotum+0x78:unix`av_dispatch_softvect+0x5f:unix`dispatch_softint+0x34:unix`switch_sp_and_call+0x10:') ;