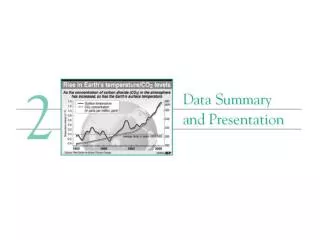
2-1 Data Summary and Display
450 likes | 603 Vues
2-1 Data Summary and Display. 2-1 Data Summary and Display. 2-1 Data Summary and Display. 2-1 Data Summary and Display. Population Mean For a finite population with N measurements, the mean is. The sample mean is a reasonable estimate of the population mean.

2-1 Data Summary and Display
E N D
Presentation Transcript
2-1 Data Summary and Display Population Mean For a finite population with N measurements, the mean is The sample mean is a reasonable estimate of the population mean.
2-1 Data Summary and Display Sample Variance and Sample Standard Deviation
2-1 Data Summary and Display The sample variance is The sample standard deviation is
2-1 Data Summary and Display Computational formula for s2
2-1 Data Summary and Display Population Variance When the population is finite and consists of N values, we may define the population variance as The sample variance is a reasonable estimate of the population variance.
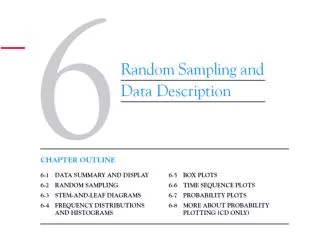
2-2 Stem-and-Leaf Diagram Steps for Constructing a Stem-and-Leaf Diagram
2-3 Histograms A histogramis a more compact summary of data than a stem-and-leaf diagram. To construct a histogram for continuous data, we must divide the range of the data into intervals, which are usually called class intervals, cells, or bins. If possible, the bins should be of equal width to enhance the visual information in the histogram.
2-3 Histograms An important variation of the histogram is the Pareto chart. This chart is widely used in quality and process improvement studies where the data usually represent different types of defects, failure modes, or other categories of interest to the analyst. The categories are ordered so that the category with the largest number of frequencies is on the left, followed by the category with the second largest number of frequencies, and so forth.
2-4 Box Plots • The box plotis a graphical display that simultaneously describes several important features of a data set, such as center, spread, departure from symmetry, and identification of observations that lie unusually far from the bulk of the data. • Whisker • Outlier • Extreme outlier
2-5 Time Series Plots • A time seriesor time sequenceis a data set in which the observations are recorded in the order in which they occur. • A time series plotis a graph in which the vertical axis denotes the observed value of the variable (say x) and the horizontal axis denotes the time (which could be minutes, days, years, etc.). • When measurements are plotted as a time series, we • often see • trends, • cycles, or • other broad features of the data
2-6 Multivariate Data • The dot diagram, stem-and-leaf diagram, histogram, and box plot are descriptive displays for univariate data; that is, they convey descriptive information about a single variable. • Many engineering problems involve collecting and analyzing multivariate data, or data on several different variables. • In engineering studies involving multivariate data, often the objective is to determine the relationships among the variables or to build an empirical model.
2-6 Multivariate Data Sample Correlation Coefficient