Chapter 18 Introduction to Quality and Statistical Process Control
590 likes | 882 Vues
Business Statistics. Chapter 18 Introduction to Quality and Statistical Process Control. Chapter Goals. After completing this chapter, you should be able to: Use the seven basic tools of quality Construct and interpret x-bar and R-charts Construct and interpret p-charts

Chapter 18 Introduction to Quality and Statistical Process Control
E N D
Presentation Transcript
Business Statistics Chapter 18Introduction to Quality and Statistical Process Control Tran Van Hoang - hoangtv@ftu.edu.vn - Business Statistics
Chapter Goals After completing this chapter, you should be able to: • Use the seven basic tools of quality • Construct and interpret x-bar and R-charts • Construct and interpret p-charts • Construct and interpret c-charts Tran Van Hoang - hoangtv@ftu.edu.vn - Business Statistics
Chapter Overview Quality Management and Tools for Improvement Tools for Quality Improvement Philosophy of Quality Deming’s 14 Points The Basic 7 Tools Control Charts Juran’s 10 Steps to Quality Improvement X-bar/R-charts p-charts c-charts Tran Van Hoang - hoangtv@ftu.edu.vn - Business Statistics
Themes of Quality Management • Primary focus is on process improvement • Most variations in process are due to systems • Teamwork is integral to quality management • Customer satisfaction is a primary goal • Organization transformation is necessary • It is important to remove fear • Higher quality costs less Tran Van Hoang - hoangtv@ftu.edu.vn - Business Statistics
Deming’s 14 Points • 1. Create a constancy of purpose toward improvement • become more competitive, stay in business, and provide jobs • 2. Adopt the new philosophy • Better to improve now than to react to problems later • 3. Stop depending on inspection to achieve quality -- build in quality from the start • Inspection to find defects at the end of production is too late • 4. Stop awarding contracts on the basis of low bids • Better to build long-run purchaser/supplier relationships Tran Van Hoang - hoangtv@ftu.edu.vn - Business Statistics
Deming’s 14 Points (continued) • 5. Improve the system continuously to improve quality and thus constantly reduce costs • 6. Institute training on the job • Workers and managers must know the difference between common cause and special cause variation • 7. Institute leadership • Know the difference between leadership and supervision • 8. Drive out fear so that everyone may work effectively. • 9. Break down barriers between departments so that people can work as a team. Tran Van Hoang - hoangtv@ftu.edu.vn - Business Statistics
Deming’s 14 Points (continued) • 10. Eliminate slogans and targets for the workforce • They can create adversarial relationships • 11. Eliminate quotas and management by objectives • 12. Remove barriers to pride of workmanship • 13. Institute a vigorous program of education and self-improvement • 14. Make the transformation everyone’s job Tran Van Hoang - hoangtv@ftu.edu.vn - Business Statistics
Juran’s 10 Steps to Quality Improvement • 1. Build awareness of both the need for improvement and the opportunity for improvement • 2. Set goals for improvement • 3. Organize to meet the goals that have been set • 4. Provide training • 5. Implement projects aimed at solving problems Tran Van Hoang - hoangtv@ftu.edu.vn - Business Statistics
Juran’s 10 Steps to Quality Improvement (continued) • 6. Report progress • 7. Give recognition • 8. Communicate the results • 9. Keep score • 10. Maintain momentum by building improvement into the company’s regular systems Tran Van Hoang - hoangtv@ftu.edu.vn - Business Statistics
The Deming Cycle Plan The Deming Cycle Act Do The key is a continuous cycle of improvement Study Tran Van Hoang - hoangtv@ftu.edu.vn - Business Statistics
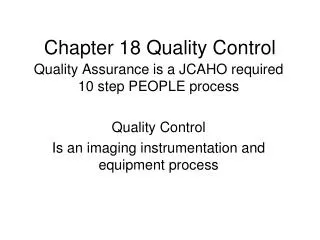
The Basic 7 Tools • Process Flowcharts • Brainstorming • Fishbone Diagram • Histogram • Trend Charts • Scatter Plots • Statistical Process Control Charts Tran Van Hoang - hoangtv@ftu.edu.vn - Business Statistics
The Basic 7 Tools (continued) • Process Flowcharts • Brainstorming • Fishbone Diagram • Histogram • Trend Charts • Scatter Plots • Statistical Process Control Charts Map out the process to better visualize and understand opportunities for improvement Tran Van Hoang - hoangtv@ftu.edu.vn - Business Statistics
The Basic 7 Tools (continued) • Process Flowcharts • Brainstorming • Fishbone Diagram • Histogram • Trend Charts • Scatter Plots • Statistical Process Control Charts Fishbone (cause-and-effect) diagram: Cause 1 Cause 2 Sub-causes Problem Sub-causes Cause 4 Cause 3 Show patterns of variation Tran Van Hoang - hoangtv@ftu.edu.vn - Business Statistics
The Basic 7 Tools (continued) • Process Flowcharts • Brainstorming • Fishbone Diagram • Histogram • Trend Charts • Scatter Plots • Statistical Process Control Charts Identify trend y time Examine relationships y x Tran Van Hoang - hoangtv@ftu.edu.vn - Business Statistics
The Basic 7 Tools (continued) • Process Flowcharts • Brainstorming • Fishbone Diagram • Histogram • Trend Charts • Scatter Plots • Statistical Process Control Charts Examine the performance of a process over time X time Tran Van Hoang - hoangtv@ftu.edu.vn - Business Statistics
Introduction to Control Charts • Control Charts are used to monitor variation in a measured value from a process • Exhibits trend • Can make correction before process is out of control • A process is a repeatable series of steps leading to a specific goal • Inherent variation refers to process variation that exists naturally. This variation can be reduced but not eliminated Tran Van Hoang - hoangtv@ftu.edu.vn - Business Statistics
Process Variation Total Process Variation Common Cause Variation Special Cause Variation = + • Variation is natural; inherent in the world around us • No two products or service experiences are exactly the same • With a fine enough gauge, all things can be seen to differ Tran Van Hoang - hoangtv@ftu.edu.vn - Business Statistics
Sources of Variation Total Process Variation Common Cause Variation Special Cause Variation = + Variation is often due to differences in: • People • Machines • Materials • Methods • Measurement • Environment Tran Van Hoang - hoangtv@ftu.edu.vn - Business Statistics
Common Cause Variation Total Process Variation Common Cause Variation Special Cause Variation = + Common cause variation • naturally occurring and expected • the result of normal variation in materials, tools, machines, operators, and the environment Tran Van Hoang - hoangtv@ftu.edu.vn - Business Statistics
Special Cause Variation Total Process Variation Common Cause Variation Special Cause Variation = + Special cause variation • abnormal or unexpected variation • has an assignable cause • variation beyond what is considered inherent to the process Tran Van Hoang - hoangtv@ftu.edu.vn - Business Statistics
Statistical Process Control Charts • Show when changes in data are due to: • Special or assignable causes • Fluctuations not inherent to a process • Represents problems to be corrected • Data outside control limits or trend • Common causes or chance • Inherent random variations • Consist of numerous small causes of random variability Tran Van Hoang - hoangtv@ftu.edu.vn - Business Statistics
Control Chart Basics Special Cause Variation: Range of unexpected variability UCL Common Cause Variation: range of expected variability +3σ Process Average -3σ LCL time UCL = Process Average + 3 Standard Deviations LCL = Process Average – 3 Standard Deviations Tran Van Hoang - hoangtv@ftu.edu.vn - Business Statistics
Process Variability Special Cause of Variation: A measurement this far from the process average is very unlikely if only expected variation is present UCL ±3σ → 99.7% of process values should be in this range Process Average LCL time UCL = Process Average + 3 Standard Deviations LCL = Process Average – 3 Standard Deviations Tran Van Hoang - hoangtv@ftu.edu.vn - Business Statistics
Statistical Process Control Charts Statistical Process Control Charts X-bar charts and R-charts p-charts c-charts Used for measured numeric data Used for proportions (attribute data) Used for number of attributes per sampling unit Tran Van Hoang - hoangtv@ftu.edu.vn - Business Statistics
x-bar chart and R-chart • Used for measured numeric data from a process • Start with at least 20 subgroups of observed values • Subgroups usually contain 3 to 6 observations each Tran Van Hoang - hoangtv@ftu.edu.vn - Business Statistics
Steps to create an x-chart and an R-chart • Calculate subgroup means and ranges • Compute the average of the subgroup means and the average range value • Prepare graphs of the subgroup means and ranges as a line chart Tran Van Hoang - hoangtv@ftu.edu.vn - Business Statistics
Steps to create an x-chart and an R-chart (continued) • Compute the upper and lower control limits for the x-bar chart • Compute the upper and lower control limits for the R-chart • Use lines to show the control limits on the x-bar and R-charts Tran Van Hoang - hoangtv@ftu.edu.vn - Business Statistics
Example: x-chart • Process measurements: Tran Van Hoang - hoangtv@ftu.edu.vn - Business Statistics
Average of Subgroup Means and Ranges Average of subgroup means: Average of subgroup ranges: where: xi = ith subgroup average k = number of subgroups where: Ri = ith subgroup range k = number of subgroups Tran Van Hoang - hoangtv@ftu.edu.vn - Business Statistics
Computing Control Limits • The upper and lower control limits for an x-chart are generally defined as • or UCL = Process Average + 3 Standard Deviations LCL = Process Average – 3 Standard Deviations Tran Van Hoang - hoangtv@ftu.edu.vn - Business Statistics
Computing Control Limits (continued) • Since control charts were developed before it was easy to calculate σ, the interval was formed using R instead • The value A2R is used to estimate 3σ , where A2 is from Appendix Q • The upper and lower control limits are where A2 = Shewhart factor for subgroup size n from appendix Q Tran Van Hoang - hoangtv@ftu.edu.vn - Business Statistics
Example: R-chart • The upper and lower control limits for an R-chart are where: D4 and D3 are taken from the Shewhart table (appendix Q) for subgroup size = n Tran Van Hoang - hoangtv@ftu.edu.vn - Business Statistics
x-chart and R-chart UCL x-chart LCL time UCL R-chart LCL time Tran Van Hoang - hoangtv@ftu.edu.vn - Business Statistics
Using Control Charts • Control Charts are used to check for process control H0: The process is in control i.e., variation is only due to common causes HA: The process is out of control i.e., special cause variation exists • If the process is found to be out of control, steps should be taken to find and eliminate the special causes of variation Tran Van Hoang - hoangtv@ftu.edu.vn - Business Statistics
Process In Control • Process in control: points are randomly distributed around the center line and all points are within the control limits UCL LCL time Tran Van Hoang - hoangtv@ftu.edu.vn - Business Statistics
Process Not in Control Out of control conditions: • One or more points outside control limits • Nine or more points in a row on one side of the center line • Six or more points movingin the same direction • 14 or more points alternating above and below the center line Tran Van Hoang - hoangtv@ftu.edu.vn - Business Statistics
Process Not in Control • One or more points outside control limits • Nine or more points in a row on one side of the center line UCL UCL LCL LCL • Six or more points moving in the same direction • 14 or more points alternating above and below the center line UCL UCL LCL LCL Tran Van Hoang - hoangtv@ftu.edu.vn - Business Statistics
Out-of-control Processes • When the control chart indicates an out-of-control condition (a point outside the control limits or exhibiting trend, for example) • Contains both common causes of variation and assignable causes of variation • The assignable causes of variation must be identified • If detrimental to the quality, assignable causes of variation must be removed • If increases quality, assignable causes must be incorporated into the process design Tran Van Hoang - hoangtv@ftu.edu.vn - Business Statistics
p-Chart • Control chart for proportions • Is an attribute chart • Shows proportion of nonconforming items • Example -- Computer chips: Count the number of defective chips and divide by total chips inspected • Chip is either defective or not defective • Finding a defective chip can be classified a “success” Tran Van Hoang - hoangtv@ftu.edu.vn - Business Statistics
p-Chart (continued) • Used with equal or unequal sample sizes (subgroups) over time • Unequal sizes should not differ by more than ±25% from average sample sizes • Easier to develop with equal sample sizes • Should have np > 5 and n(1-p) > 5 Tran Van Hoang - hoangtv@ftu.edu.vn - Business Statistics
Creating a p-Chart • Calculate subgroup proportions • Compute the average of the subgroup proportions • Prepare graphs of the subgroup proportions as a line chart • Compute the upper and lower control limits • Use lines to show the control limits on the p-chart Tran Van Hoang - hoangtv@ftu.edu.vn - Business Statistics
p-Chart Example Tran Van Hoang - hoangtv@ftu.edu.vn - Business Statistics
Average of Subgroup Proportions The average of subgroup proportions = p If equal sample sizes: If unequal sample sizes: where: pi = sample proportion for subgroup i k = number of subgroups of size n where: ni = number of items in sample i ni = total number of items sampled in k samples Tran Van Hoang - hoangtv@ftu.edu.vn - Business Statistics
Computing Control Limits • The upper and lower control limits for an p-chart are • or UCL = Average Proportion + 3 Standard Deviations LCL = Average Proportion – 3 Standard Deviations Tran Van Hoang - hoangtv@ftu.edu.vn - Business Statistics
Standard Deviation of Subgroup Proportions • The estimate of the standard deviation for the subgroup proportions is If equal sample sizes: If unequal sample sizes: Generally, is computed separately for each different sample size where: = mean subgroup proportion n = common sample size Tran Van Hoang - hoangtv@ftu.edu.vn - Business Statistics
Computing Control Limits (continued) • The upper and lower control limits for the p-chart are Proportions are never negative, so if the calculated lower control limit is negative, set LCL = 0 • If sample sizes are equal, this becomes Tran Van Hoang - hoangtv@ftu.edu.vn - Business Statistics
p-Chart Examples • For equal sample sizes • For unequal sample sizes UCL UCL p p LCL LCL is constant since n is the same for all subgroups varies for each subgroup since ni varies Tran Van Hoang - hoangtv@ftu.edu.vn - Business Statistics
c-Chart • Control chart for number of nonconformities (occurrences) per sampling unit (an area of opportunity) • Also a type of attribute chart • Shows total number of nonconforming items per unit • examples: number of flaws per pane of glass number of errors per page of code • Assume that the size of each sampling unit remains constant Tran Van Hoang - hoangtv@ftu.edu.vn - Business Statistics
Mean and Standard Deviationfor a c-Chart • The mean for a c-chart is • The standard deviation for a c-chart is where: xi = number of successes per sampling unit k = number of sampling units Tran Van Hoang - hoangtv@ftu.edu.vn - Business Statistics
c-Chart Control Limits The control limits for a c-chart are Tran Van Hoang - hoangtv@ftu.edu.vn - Business Statistics


![Seven Quality Tools [Statistical Process Control]](https://cdn3.slideserve.com/6416179/seven-quality-tools-statistical-process-control-dt.jpg)