Download

1 / 43
430 likes | 712 Vues
Introduction to Affymetrix Microarrays. Stem Cell Network Microarray Course, Unit 1 August 2006. Goals. Review technology & terminology of Affymetrix GeneChips Describe some methods for processing raw data from Affymetrix chips and generating expression values.

E N D
Introduction to Affymetrix Microarrays Stem Cell Network Microarray Course, Unit 1 August 2006
Goals • Review technology & terminology of Affymetrix GeneChips • Describe some methods for processing raw data from Affymetrix chips and generating expression values. • Show relative benefits of each methodology.
What is a Microarray? • “Microarray” has become a general term, there are many types now • DNA microarrays • Protein microarrays • Transfection microarrays • Tissue microarray • … • We’ll be discussing cDNA microarrays
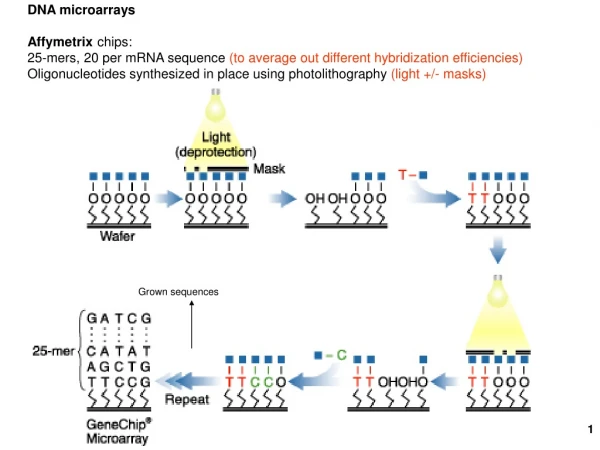
What is a DNA Microarray (very generally) • A grid of DNA spots (probes) on a substrate used to detect complementary sequences • The DNA spots can be deposited by • piezolectric (ink jet style) • Pen • Photolithography (Affymetrix) • The substrate can be plastic, glass, silicon (Affymetrix) • RNA/DNA of interest is labelled & hybridizes with the array • Hybridization with probes is detected optically.
Types of DNA microarrays and their uses • What is measured depends on the chip design and the laboratory protocol: • Expression • Measure mRNA expression levels (usually polyadenylated mRNA) • Resequencing • Detect changes in genomic regions of interest • Tiling • Tiles probes over an entire genome for various applications (novel transcripts, ChIP, epigenetic modifications) • SNP • Detect which known SNPs are in the tested DNA • ?...
What do Expression Arrays really measure? • Gene Expression • mRNA levels in a cell • mRNA levels averaged over a population of cells in a sample • relative mRNA levels averaged over populations of cells in multiple samples • relative mRNA hybridization readings averaged over populations of cells in multiple samples • some relative mRNA hybridization readings averaged over populations of cells in multiple samples
Why “some” & “multiple samples” • “some” • In a comparison of Affymetrix vs spotted arrays, 10% of probesets yielded very different results. • “In the small number of cases in which platforms yielded discrepant results, qRT-PCR generally did not confirm either set of data, suggesting that sequence-specific effects may make expression predictions difficult to make using any technique.”* • It appears that some transcripts just can’t be detected accurately by these techniques. * Independence and reproducibility across microarray platforms., Quackenbush et al. Nat Methods. 2005 May;2(5):337-44
Why “multiple samples” • “multiple samples” • We can only really depend on between-sample fold change for Microarrays not absolute values or within sample comparisons (>1.3-2.0 fold change, in general)
Central “Assumption” of Gene Expression Microarrays • The level of a given mRNA is positively correlated with the expression of the associated protein. • Higher mRNA levels mean higher protein expression, lower mRNA means lower protein expression • Other factors: • Protein degradation, mRNA degradation, polyadenylation, codon preference, translation rates, alternative splicing, translation lag… • This is relatively obvious, but worth emphasizing
Affymetrix Expression Arrays http://www.affymetrix.com/technology/ge_analysis/index.affx
Affymetrix File Types • DAT file: • Raw (TIFF) optical image of the hybridized chip • CDF File (Chip Description File): • Provided by Affy, describes layout of chip • CEL File: • Processed DAT file (intensity/position values) • CHP File: • Experiment results created from CEL and CDF files • TXT File: • Probeset expression values with annotation (CHP file in text format) • EXP File • Small text file of Experiment details (time, name, etc) • RPT File • Generated by Affy software, report of QC info
Affymetrix Data Flow CDF file CHP file Hybridized GeneChip DAT file TXT file CEL file Process Image (GCOS) MAS5 (GCOS) Scan Chip EXP file RPT file
Affymetrix Expression GeneChip Terminology • A chip consists of a number of probesets. • Probesets are intended to measure expression for a specific mRNA • Each probeset is complementary to a target sequence which is derived from one or more mRNA sequences • Probesets consist of 25mer probe pairsselected from the target sequence: one Perfect Match (PM) and one Mismatch (MM) for each chosen target position. • Each chip has a corresponding Chip Description File (CDF) which (among other things) describes probe locations and probeset groupings on the chip.
Choosing probes • How are taget sequences and probes chosen? • Target sequences are selected from the 3’ end of the transcript • Probes should be unique in genome (unless probesets are intended to cross hybridize) • Probes should not hybridize to other sequences in fragmented cDNA • Thermodynamic properties of probes • See Affymetrix docs for more details http://www.affymetrix.com/support/technical/technotes/hgu133_p2_technote.pdf
Affymetrix Probeset Names • Probeset identifiers beginning with AFFX are affy internal, not generally used for analysis • Suffixes are meaningful, for example: • _at : hybridizes to unique antisense transcript for this chip • _s_at: all probes cross hybridize to a specified set of sequences • _a_at: all probes cross hybridize to a specified gene family • _x_at: at least some probes cross hybridize with other target sequences for this chip • _r_at: rules dropped (my favorite!) • and many more… • See the Affymetrix document “Data Analysis Fundamentals” for details
Target Sequences and Probes Example: • 1415771_at: • Description: Mus musculus nucleolin mRNA, complete cds • LocusLink: AF318184.1 (NT sequence is 2412 bp long) • Target Sequence is 129 bp long 11 probe pairs tiling the target sequence gagaagtcaaccatccaaaactctgtttgtcaaaggtctgtctgaggataccactgaagagaccttaaaagaatcatttgagggctctgttcgtgcaagaatagtcactgatcgggaaactggttctt gagaagtcaaccatccaaaactctgtttgtcaaaggtctgtctgaggataccactgaagagaccttaaaagaatcatttgagggctctgttcgtgcaagaatagtcactgatcgggaaactggttctt gagaagtcaaccatccaaaactctgtttgtcaaaggtctgtctgaggataccactgaagagaccttaaaagaatcatttgagggctctgttcgtgcaagaatagtcactgatcgggaaactggttctt gagaagtcaaccatccaaaactctgtttgtcaaaggtctgtctgaggataccactgaagagaccttaaaagaatcatttgagggctctgttcgtgcaagaatagtcactgatcgggaaactggttctt gagaagtcaaccatccaaaactctgtttgtcaaaggtctgtctgaggataccactgaagagaccttaaaagaatcatttgagggctctgttcgtgcaagaatagtcactgatcgggaaactggttctt gagaagtcaaccatccaaaactctgtttgtcaaaggtctgtctgaggataccactgaagagaccttaaaagaatcatttgagggctctgttcgtgcaagaatagtcactgatcgggaaactggttctt gagaagtcaaccatccaaaactctgtttgtcaaaggtctgtctgaggataccactgaagagaccttaaaagaatcatttgagggctctgttcgtgcaagaatagtcactgatcgggaaactggttctt gagaagtcaaccatccaaaactctgtttgtcaaaggtctgtctgaggataccactgaagagaccttaaaagaatcatttgagggctctgttcgtgcaagaatagtcactgatcgggaaactggttctt gagaagtcaaccatccaaaactctgtttgtcaaaggtctgtctgaggataccactgaagagaccttaaaagaatcatttgagggctctgttcgtgcaagaatagtcactgatcgggaaactggttctt gagaagtcaaccatccaaaactctgtttgtcaaaggtctgtctgaggataccactgaagagaccttaaaagaatcatttgagggctctgttcgtgcaagaatagtcactgatcgggaaactggttctt gagaagtcaaccatccaaaactctgtttgtcaaaggtctgtctgaggataccactgaagagaccttaaaagaatcatttgagggctctgttcgtgcaagaatagtcactgatcgggaaactggttctt
Perfect Match and Mismatch Target tttccagacagactcctatggtgacttctctggaat Perfect match ctgtctgaggataccactgaagaga ctgtctgaggattccactgaagaga Mismatch Probe pair
Affymetrix Chip Pseudo-image *image created using dChip software
1415771_at on MOE430A *image created using dChip software
1415771_at on MOE430A PM MM *Note that PM, MM are always adjacent *image created using dChip software
1415771_at on MOE430A Probe pair PM MM Intensity PM Probeset MM Probe pair *images created using dChip software
Intensity to Expression • Now we have thousands of intensity values associated with probes, grouped into probesets. • How do you transform intensity to expression values? • Algorithms • MAS5 • Affymetrix proprietary method • RMA/GCRMA • Irizarry, Bolstad • ..many others • Often called “normalization”
Common elements of different techniques • All techniques do the following: • Background adjustment • Scaling • Aggregation • The goal is to remove non-biological elements of the signal
MAS5 • Standard Affymetrix analysis, best documented in: http://www.affymetrix.com/support/technical/whitepapers/sadd_whitepaper.pdf • MAS5 results can’t be exactly reproduced based on this document, though the affy package in Bioconductor comes close. • MAS5 C++ source code released by Affy under GPL in 2005
MAS5 Model • Measured Value = N + P + S • N = Noise • P = Probe effects (non-specific hybridization) • S = Signal
MAS5: Background & Noise • Background • Divide chip into zones • Select lowest 2% intensity values • stdev of those values is zone variability • Background at any location is the sum of all zones background, weighted by 1/((distance^2) + fudge factor) • Noise • Using same zones as above • Select lowest 2% background • stedev of those values is zone noise • Noise at any location is the sum of all zone noise as above • From http://www.affymetrix.com/support/technical/whitepapers/sadd_whitepaper.pdf
MAS5: Adjusted Intensity A = Intensity minus background, the final value should be > noise. A: adjusted intensity I: measured intensity b: background NoiseFrac: default 0.5 (another fudge factor) And the value should always be >=0.5 (log issues) (fudge factor) • From http://www.affymetrix.com/support/technical/whitepapers/sadd_whitepaper.pdf
MAS5: Ideal Mismatch Because Sometimes MM > PM • From http://www.affymetrix.com/support/technical/whitepapers/sadd_whitepaper.pdf
MAS5: Signal Value for each probe: Modified mean of probe values: Scaling Factor (Sc default 500) Signal (nf=1) ReportedValue(i) = nf * sf * 2 (SignalLogValuei) Tbi = Tukey Biweight (mean estimate, resistant to outliers) TrimMean = Mean less top and bottom 2% • From http://www.affymetrix.com/support/technical/whitepapers/sadd_whitepaper.pdf
MAS5: p-value and calls • First calculate discriminant for each probe pair: R=(PM-MM)/(PM+MM) • Wilcoxon one sided ranked test used to compare R vs tau value and determine p-value • Present/Marginal/Absent calls are thresholded from p=value above and • Present =< alpha1 • alpha1 < Marginal < alpha2 • Alpha2 <= Absent • Default: alpha1=0.04, alpha2=0.06, tau=0.015
MAS5: Summary • Good • Usable with single chips (though replicated preferable) • Gives a p-value for expression data • Bad: • Lots of fudge factors in the algorithm • Not *exactly* reproducible based upon documentation (source now available) • Misc • Most commonly used processing method for Affy chips • Highly dependent on Mismatch probes
RMA • Robust Multichip Analysis • Used with groups of chips (>3), more chips are better • Assumes all chips have same background, distribution of values: do they? • Does not use the MM probes as (PM-MM*) leads to high variance • This means that half the probes on the chip are excluded, yet it still gives good results! • Ignoring MM decreases accuracy, increases precision.
RMA Model From a presentation by Ben Bolstad http://bioinformatics.ca/workshop_pages/genomics/lectures2004/16
RMA Background This provides background correction From a presentation by Ben Bolstad http://bioinformatics.ca/workshop_pages/genomics/lectures2004/16
RMA: Quantile Normalization & Scaling • Fit all the chips to the same distribution • Scale the chips so that they have the same mean. From a presentation by Ben Bolstad http://bioinformatics.ca/workshop_pages/genomics/lectures2004/16
RMA: Estimate Expression • assumption that these log transformed, background corrected expression values follow a linear model, • Linear Model is estimated by using a “median polish” algorithm • Generates a model based on chip, probe and a constant
GCRMA: Background Adjustment Sequence specificity of brightness in the PM probes. PHYSICAL REVIEW E 68, 011906 ~2003!
(GC)RMA: Summary • Good: • Results are log2 • GCRMA: Adjusts for probe sequence effects • Rigidly model based: defines model then tries to fit experimental data to the model. Fewer fudge factors than MAS5 • Bad • Does not provide “calls” as MAS5 does • Misc • The input is a group of samples that have same distribution of intensities. • Requires multiple samples
Comparison (Affy spike in data set) Non-spike in (fold change) Spike in Nature Biotechnology22, 656 - 658 (2004) doi:10.1038/nbt0604-656b
How many replicates? 3 or more Biological Replicates is a minimum! Biological Replicates • Recreate the experiment several times. This gives a sense of biological variability. Technical Replicates • Don’t bother unless you’re doing a technical study of microarray variability.
Unit 1 Exercises • Downloading microarray data from StemBase • Generating MAS5, RMA, GCRMA expression values using R • Comparing expression values with each other • Determining fold change of probesets for MAS5, RMA, GCRMA results.
Conclusion • Please contact ogicinfo@ohri.ca if you have any comments, corrections or questions. • See associated bibliography for references from this presentation and further reading. • Thanks for your attention!