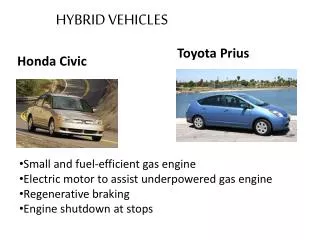
Why Hybrid Vehicles?
600 likes | 881 Vues
Why Hybrid Vehicles?. If you want a CD or handout of this lecture contact: L. David Roper Professor Emeritus of Physics Virginia Polytechnic Inst. & St. Univ. roperld@vt.edu http://arts.bev.net/roperldavid. http://www.msnbc.msn.com/id/10642724 http://www.hybridcenter.org.

Why Hybrid Vehicles?
E N D
Presentation Transcript
Why Hybrid Vehicles? If you want a CD or handout of this lecture contact: L. David Roper Professor Emeritus of Physics Virginia Polytechnic Inst. & St. Univ. roperld@vt.edu http://arts.bev.net/roperldavid http://www.msnbc.msn.com/id/10642724 http://www.hybridcenter.org
Why Hybrid Vehicles? • Emissions from vehicles is causing global warming and human sickness. • Oil extraction peaked in the U.S. in the early 1970s. • Oil extraction is peaking for the world about now. • Natural gas extraction peaked in the U.S. in the late 1970s. • Natural gas extraction for the world will peak within a decade or two. • Hybrid vehicles produce much less emissions and use about 50% less fuel than the average new vehicle in the same class. (Partial-Zero emissions) • Plug-in Hybrid vehicles eventually will be charged at parking locations using renewable energy. They will use at least half as much fuel as do hybrids.
U.S. Oil Extraction This fit to the data gives future reserves as ~1.5 times 2003 proven reserves. Alaska increment My birth. It will mostly be gone when I am 100 years old. Note the desperation jitter that occurs near an extraction peak. U.S. oil discoveries peaked about 1930.
Watch this grow in the future! From International Energy Agency. ROW = Rest of the World. It is easy to see why the U.S. starts wars for oil.
U. S. Oil Consumption and Imports The Arctic National Wildlife Refuge is estimated to contain 7x10⁹ barrels of oil; about one year's supply for the U.S., a mere blip on Alaska extraction. Alaska extraction peaked in 1988 about 10 years after it started. http://www.eia.gov
Natural Gas Facts • The main component is methane (CH4). • Natural Gas burns cleaner than gasoline or diesel. (I used butane/propane @ $0.17/gallon in my vehicle while in college 1954-8.) • Power companies prefer natural gas rather than coal as a fuel because it is cleaner burning and easier to transport by pipelines. • 33% of U.S. energy comes from natural gas. • 95% of nitrogen fertilizer used by U.S. farmers is made from natural gas. Increasingly being imported because of high prices for U.S. natural gas. • “Natural gas” can be made from sewage and extracted from land fills. Future power stations need to be located at land fills and sewage plants and/or where the heat generated can be used (co-generation).
U.S. Natural Gas Extraction This fit to the data gives future reserves as ~5 times 2003 proven reserves. About 15% of consumption imported, mostly from Canada. Largest reserves are in Russia, Iran and Qatar. Note the desperation jitter.
World Oil Discoveries http://www.durangobill.com/Rollover.html from ExxonMobil
World Oil Extraction Note the desperation jitter. World oil discoveries peaked about 1965.
World Oil Extraction Per Capita http://dieoff.com/page224.htm Barrels of crude oil per capita per year for the World. The prediction is calculated using fits to World petroleum extraction rates and population.
1947-2004 http://www.wtrg.com/oil_graphs/oilprice1947.gif
The fit is to the data after Jan 2002. http://www.eia.doe.gov Daily prices: http://www.wtrg.com/daily/clfclose.gif
A World economic slump or collapse will probably keep oil prices from rising this rapidly. http://www.eia.doe.gov
Eventually the price of oil will approach some asymptote after only the dregs are left to be extracted from the Earth and after humans quit burning it and recycle it instead.
The fit is to the data after Jan 1999. http://www.eia.doe.gov Daily prices: http://www.wtrg.com/daily/ngfclose.gif
What about Using Ethanol and/or Biodiesel for Fuel? Farmers must use biofuels to produce biofuels, not petrofuels! www.khoslaventures.com/presentations/Biofuels_Dec2005.v3.2.ppt Closed carbon dioxide greenhouse gas cycle for biofuels. Ethanol & biodiesel are sustainable forms of solar energy.
What if biodiesel were made from biowaste? It takes 10% more energy to make gasoline than gasoline yields as a fuel. Current disagreement Need to use ethanol to produce ethanol!
Ethanol as a Fuel The availability of E85 filling stations in 35 states in the United States. http://www.e85fuel.com/database/search.php • Two mixtures of gasoline and alcohol are available at a few fuel stations in the United States: E10=10% ethanol (101 octane) by volume and E85=85% ethanol (105 octane) by volume. Unfortunately, World production of ethanol for fuel has not been increasing very rapidly. http://www.e85fuel.com • All vehicles since the 1970s are capable of burning E10, but filling stations are not widely available. • One could create E10 at E85 filling stations by putting in about 8.35 of gasoline for each gallon of E85, as calculated from:0.1 = 0.85e/(g + 0.15e) where e = amount of E85 and g = amount of gasoline. • A list of Flexible Fuel Vehicles (FFV) can be found athttp://www.e85fuel.com/e85101/flexfuelvehicles.php .l In 2006 General Motors made 6 FFVs, Daimler Chrysler made 5, Ford made 5 and Nissan made 1. General Motors and Ford Motor Company are promising more in the future: http://www.gm.com/company/gmability/environment/e85/index.htmlhttp://media.ford.com/newsroom/feature_display.cfm?release=21949 Virginia is way behind! Flexible Fuel Vehicles can burn gasoline and E85 or diesel and biodiesel. It costs $100 extra to make a vehicle FFV. Ford plans to market a FFV version of the Escape hybrid.
Brazil and Ethanolwww.khoslaventures.com/presentations/Biofuels_Dec2005.v3.2.ppt =E85 or gasoline = E10
Ethanol (Brazil) versus Gasoline Prices(1980->2002 $US/GigaJoule)www.khoslaventures.com/presentations/Biofuels_Dec2005.v3.2.ppt Ethanol in Brazil Gasoline in Rotterdam
Brazil sugar-cane/ethanol learning curve Liters of ethanol produced per hectare between 1975 to 2004www.khoslaventures.com/presentations/Biofuels_Dec2005.v3.2.ppt
Methanol Economy • New efficient ways to create methanol (& dimethyl ether) from methane: 2CH4+O2->2CH3OH • Create methanol from CO2 at power plants and from air: 2CO2+4H2O->2CH3OH+3O2 • Use methanol (dimethyl ether) as replacements for gasoline (diesel) and in fuel cells. 2CH3OH+3O2->2CO2+4H2O • Use methanol as replacement for petroleum for hydrocarbon products. • Beyond Oil and Gas: The Methanol Economy by Olah, Goeppert & Prakash. Problem: Easier to capture CO2 at power plant than from millions of vehicles!
Biodiesel Versus Diesel • Both are 15-20% more efficient fuels than gasoline. • Diesel emits more pollutants than gasoline because each molecule has about 5 to 7 more methane units. They can be eliminated by catalytic converters, as they have been in German vehicles. • See http://www.whpubs.com/epa.pdf • Biodiesel: • Can be used in diesel engines. • Emits 50% less carbon monoxide and 78% less carbon dioxide than diesel. • Contains no sulfur. • Emits 75% less particulates than diesel. • Emits more nitrous oxides (smog) than diesel, but they can be removed by catalytic converters. • Ignites more readily in an engine but less readily in the atmosphere than does diesel. • Biodiesel may be the transport fuel of the future. • See Biodiesel by Greg Pahl and http://en.wikipedia.org/wiki/Biodiesel and http://hybridiesel.blogspot.com/2005/02/good-discussion-about-potential-of.html
Biodiesel from Algae • Over 50% of algae mass is oil. Over 30 times more oil per area than other fuel plants (e.g. soybeans). • Both fresh-water and salt-water algae. • Most efficient photoreceptors of all plants. • Liquid environment allows better access to carbon dioxide, nitrogen and minerals needed for growth. • Arid zones are ideal because of high solar exposure. • Locate beside power plants to absorb the carbon dioxide produced. • Commercial bioreactors for producing oil from algae are expected soon.
World Biodiesel Production Curve is 73% growth. Growth is faster. Biodiesel: Growing A New Energy Economy by Greg Pahl
Comparison of Biodiesel to Petroleum A 73% rate of growth in World biodiesel production would equal World petroleum extraction by about 2022.
Comparison of Vehicle Emissions for Renewable versus Nonrenewable Sources of Energy Decreasing emissions Decreasing emissions Decreasing emissions Final Goal for Vehicles!
What about Coal? • Can we extract and use coal for fuel without further destroying the environment? • Can we learn how to store the carbon to use it later to ameliorate the plunge into the next ice age? (More about this later.) • Can we get liquid and/or gas for transport fuel out of coal competitive to bioliquid and biogas? • Can we use coal to build the infrastructure for sustainable energy sources? • The U.S. national electric grid is ~45% powered by coal. (Most of the rest is natural gas.) • Full Electric vehicles reduce greenhouse emissions by 67%, even though much of their power is produced by coal power plants. • Most coal reserves are in Russia, China & U.S.
Area between red curve and data = area between black and red curves. Oil Extraction started. In about 200 years we will be very low in coal extraction. The red curve is a fit using known 2003 recoverable reserves. The drawn black curve is a rough “optimistic” guess about the future.
World will have coal to use about 100 years longer than the U.S. Eventual amount extracted: 100,248x10^6 Short Tons http://www.eia.gov/emeu/aer/txt/ptb0701.html
What about Uranium? • ~15% of U.S. electrical energy is produced from nuclear power plants. In France it is ~77%. • We will probably run short within the next century. http://afr.com/articles/2005/06/23/1119321845502.html • Safe storage of radioactive waste for tens of thousands of years (well into the next Major Ice Age) is a major problem. See Deep Time by G. Benford. • Use of uranium for Weapons of Mass Destruction, for radioactive terrorism and in warheads of standard weapons (Used extensively in the Gulf War, Bosnia War, Kosovo War & Bush Iraq War) are major problems. See: http://arts.bev.net/roperldavid/politics/WeaponsRadioactive.htm
Fit to data using known reserves Fit using 1.5 times reserves Will run out sooner than coal.
Energy Returned over Energy Invested Environmental costs are not considered in calculating these numbers! http://www.eroei.com/eval/net_energy_list.html http://www.mnforsustain.org/nukpwr_tyner_g_net_energy_from_nuclear_power.htm
A linear fit to the world energy consumption to allow projection into the future.
Since World population is projected to start leveling off, a constant increase in energy use allows a modest increase in energy per capita. The recent downturn in energy use per capita may be why population growth is slowing.
Wind and Solar Energy Power History 39,300 MegaWatts in 2004 Growing at ~25%/year. Would take about 25 years to equal total world power. 1,050 MegaWatts in 2004 Growing at ~30%/year. Would take about 35 years to equal total world power. http://www.giss.nasa.gov/edu/gwdebate/gwdebate.pdf http://www.ecotopia.com/apollo2 World power used in 2004: ~15,000,000 MegaWatts = 15 TeraWatts Wind and photovoltaic power would have to grow at 70% per year to supply all world power in about 10 years! Tehachapi Pass Wind Farm, California
Exponential Fit to World Wind Power A 25% rate of growth would make World wind power equal to World total power by 2030. As the Earth moves into the next Major Ice Age within a few thousand years, winds will increase greatly, so much more wind power will be available.
Exponential Fit to World Photovoltaic Power A 31% rate of growth would make World photovoltaic power equal to World total power by 2037. As the Earth moves into the next Major Ice Age within a few thousand years, cloudiness will decrease greatly, so more solar power may be available even though insolation will be smaller.
We are like tenant farmers chopping down the fence around our house for fuel when we should be using nature's inexhaustible sources of energy - sun, wind and tide. I'd put my money on the sun and solar energy. What a source of power! I hope we don't have to wait until oil and coal run out before we tackle that. -- Thomas Alva Edison (1847-1931)
2006 Federal Tax Credits for Home Solar Energy Installations • Photovoltaic system or solar hot-water heater (not for swimming pool or hot tub). • Federal tax credit equal to 30% of the systems' cost, up to a credit of $2,000 per system. • Must be installed from Jan. 1, 2006 through Dec. 31, 2007. • A two-kilowatt photovoltaic system that meets most of the needs of a highly energy-efficient home should cost $16,000 to $20,000 installed. • A five-kilowatt photovoltaic system for a more typical home should cost twice that; it would eliminate the home’s electricity bills. • The “Bible”: The Solar Electric House by Steven J. Strong and William G. Scheller, 1993. http://moneycentral.msn.com/content/Savinganddebt/Savemoney/P126521.asp
Conservation as a Vehicle “Fuel” • Using proven technologies to improve vehicle efficiency can save half of projected 2025 use of oil in the U.S. • The other half might be replaced by biofuels and “saved” natural gas (more efficient use of electricity). • A 2025 vehicle fleet as efficient as the best hybrid vehicles now available would save one-sixth of projected oil use. • See http://www.oilendgame.com and Winning the Oil End Game by Amory Lovins. Global Warming next
Last Major Ice Age (120,000 years long) Now Last Interglacial Homo sapiens evolved in Africa. Current Interglacial (more about this later) Previous Glacial Maximum Only Neanderthals in Europe Glacial Maximum Last Neanderthal in Europe (10^3 years) • Until about ~10,000 years ago the earth was in a long ice age for about 120,000 years, with several extreme variations in temperature on a ~10,000 year time scale. (There have been eight of these ice ages in the last one million years.) • Human beings evolved into “intelligent” animals due to the extreme climate stresses. • Why has it been so uniformly warm over the last 10,000 years? (Compare to the last interglacial ~130,000 years ago.)
North-Pole Summer Insolation Insolation = solar energy striking the top of Earth’s atmosphere. It has been declining for the last 11,000 years; so why has the temperature remained so high? North-Pole summer insolation is an important factor because accumulation of ice in the Arctic region is crucial to the Major Ice Ages and summer is when the ice can melt. Note that it peaked 11,000 years ago and will be at a minimum in about 500 years.
Neolithic Global Warming due to Carbon Dioxide Release Caused by the onset of intensive agriculture. (William F. Ruddiman, Scientific American Mar 2005, p.34. Plows, Plagues and Petroleum: How Humans Took Control of Climate by W. F. Ruddiman)
Neolithic Global Warming due to Methane Release Caused by the onset of intensive rice farming in Asia.
Anthropogenic Global Warming History and Future Future Global Warming Normal Interglacial Plunge into next ice Age. Modern Global Warming I call this “Neolithic global warming”.
Why is Global Warming Bad? The fast rise in temperature may trigger the next major ice sooner than it would otherwise occur, due to switching off Atlantic Ocean currents. Neolithic Global Warming Future Global Warming Plunge into ice Age. Modern Global Warming • Rapid changes in temperature cause agriculture possibilities to switch from one area of the world to another. Thus, many people will die due to lack of food. • Rapid increases in temperature cause more severe weather to occur, such as hurricanes. Thus, many people will die (have already died!). • Rapid increases in temperature cause the glacial ice at the North and South Poles to melt, raising sea levels; which will flood many major cities of the world.
Hurricane Power Dissipated (PDI) vsSea Surface Temperature (SST) in North Atlantic Obvious connection between high ocean surface temperature and hurricane power. http://www.realclimate.org/index.php?p=181#more-181 http://zfacts.com/p/49.html