Download
1 / 13
130 likes | 303 Vues
Determination of base cations using Ion Chromatography. We analyzed water samples for cations using IC and compared those results to ICP results to validate the decision to change analysis methods.

E N D
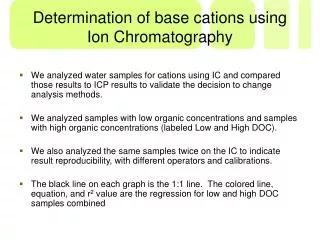
Determination of base cations usingIon Chromatography • We analyzed water samples for cations using IC and compared those results to ICP results to validate the decision to change analysis methods. • We analyzed samples with low organic concentrations and samples with high organic concentrations (labeled Low and High DOC). • We also analyzed the same samples twice on the IC to indicate result reproducibility, with different operators and calibrations. • The black line on each graph is the 1:1 line. The colored line, equation, and r2 value are the regression for low and high DOC samples combined
Determination of base cations usingIon Chromatography • Each analyte has two slides associated with it: • Slide one: • The left graph represents the average of the results of the two IC runs compared to the ICP results in µeq/L. • The right graph represents the results of the two IC runs compared to each other in µeq/L. • Slide two: • The left graph represents the comparison of average IC results to ICP results in mg/L. • The right graph represents the comparison of AA results to ICP results in mg/L. • Notice that both the IC and AA results are higher than the ICP.
Samples Analyzed Low DOC All samples takes in 2003; N=41 BBWM RLTM High DOC Acadia
Calcium analysisIC to ICP comparison vs AA to ICP comparison
Magnesium analysisIC to ICP comparison vs AA to ICP comparison
Potassium analysisIC to ICP comparison vs AA to ICP comparison
Summary Statements • Analyses were biased high towards IC for all comparisons • Analyses were also biased high towards AA for all ICP vs AA comparisons except Na • When data were analyzed separately, IC analyses differed from ICP analyses less among low DOC samples. • NH4 analysis is not running well yet. NH4 may degrade too quickly because we do not acidify samples.
Thanks to everyone for their help Tanya – analysis, data management, and sample prep Catherine – analysis and sample prep Lisa – sample prep and IC setup Ken – analysis, data management, and sample prep SK – ideas, consulting, equipment procurement