Download
1 / 4
40 likes | 69 Vues
One of the most common wastewater pollutants is organophosphorus pesticides, which have a complex of properties-high<br>solubility, toxicity, mobility in the environment. In recent years, this method has become an innovative analytical technology for<br>the most part used in medical practice and in pharmaceuticals. With development, the method begins to acquire a practical<br>application in other branches of human life activity.<br>

E N D
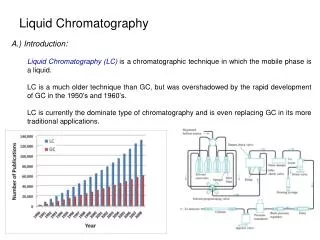
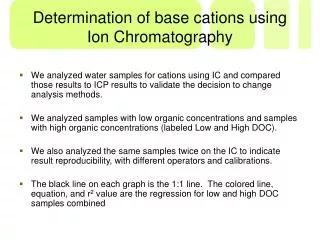
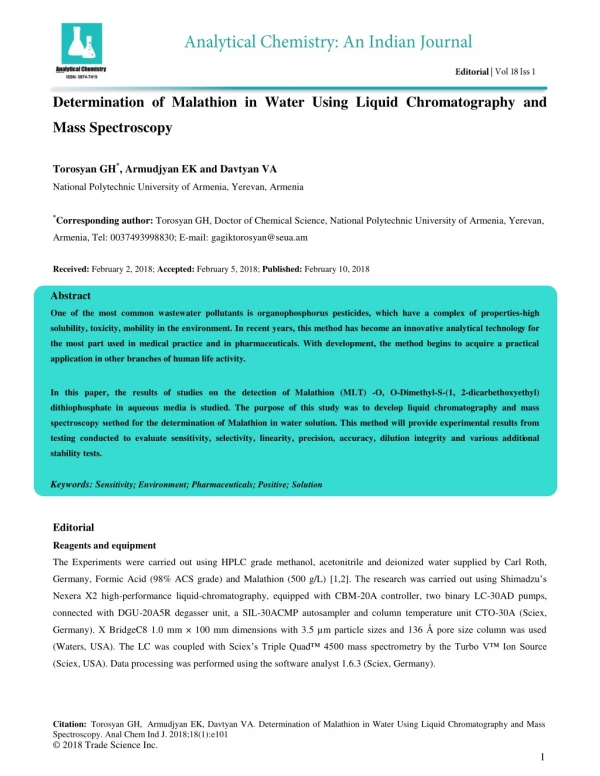
Determination of Malathion in Water Using Liquid Chromatography and Mass Spectroscopy Torosyan GH*, Armudjyan EK and Davtyan VA National Polytechnic University of Armenia, Yerevan, Armenia *Corresponding author: Torosyan GH, Doctor of Chemical Science, National Polytechnic University of Armenia, Yerevan, Armenia, Tel: 0037493998830; E-mail:gagiktorosyan@seua.am Received: February 2, 2018; Accepted: February 5, 2018; Published: February 10, 2018 Abstract One of the most common wastewater pollutants is organophosphorus pesticides, which have a complex of properties-high solubility, toxicity, mobility in the environment. In recent years, this method has become an innovative analytical technology for the most part used in medical practice and in pharmaceuticals. With development, the method begins to acquire a practical application in other branches of human life activity. In this paper, the results of studies on the detection of Malathion (MLT) -O, O-Dimethyl-S-(1, 2-dicarbethoxyethyl) dithiophosphate in aqueous media is studied. The purpose of this study was to develop liquid chromatography and mass spectroscopy мethod for the determination of Malathion in water solution. This method will provide experimental results from testing conducted to evaluate sensitivity, selectivity, linearity, precision, accuracy, dilution integrity and various additional stability tests. Keywords: Sensitivity; Environment; Pharmaceuticals; Positive;Solution Editorial Reagents and equipment The Experiments were carried out using HPLC grade methanol, acetonitrile and deionized water supplied by Carl Roth, Germany, Formic Acid (98% ACS grade) and Malathion (500 g/L) [1,2]. The research was carried out using Shimadzu’s Nexera X2 high-performance liquid-chromatography, equipped with CBM-20A controller, two binary LC-30AD pumps, connected with DGU-20A5R degasser unit, a SIL-30ACMP autosampler and column temperature unit CTO-30A (Sciex, Germany). X BridgeC8 1.0 mm × 100 mm dimensions with 3.5 µm particle sizes and 136 Å pore size column was used (Waters, USA). The LC was coupled with Sciex’s Triple Quad™ 4500 mass spectrometry by the Turbo V™ Ion Source (Sciex, USA). Data processing was performed using the software analyst 1.6.3 (Sciex, Germany). Citation:Torosyan GH,Armudjyan EK, Davtyan VA. Determination of Malathion in Water Using Liquid Chromatography and Mass Spectroscopy. Anal Chem Ind J. 2018;18(1):e101 © 2018 Trade Science Inc. 1
www.tsijournals.com | February-2018 Conditions of mass spectrometry The tuning of MS parameters was conducted in positive ionization mode using Sciex’s Triple Quad™ 4500 MS for Malathion (MLT). MLT was injected in the MS in 1 ng/mL concentration diluted in 1:1 methanol : 0.1% formic Acid and a flow rate 7 µL/min. and gave predominant singly charged protonated precursor [M+H]+ ions at m/z of 331.1 Da in Q1 full scan spectra. In the product ion mass spectrum of MLT the most abundant and consistent ions were observed at m/z 127.1 Da. Preparation of standards working solutions The concentration of the stock solution was 0.5 mg/mL. Two secondary stock solutions 5.0 µg/mL and 1.0 µg/mL were prepared from the stock solution. Serial dilution were made to obtain a final concentration of nine Calibration Curve Standards Working Solutions (CCS WS) as 1.0, 2.0, 5.0, 10.0 20.0 50.0, 100.0, 200.0 and 500.0 ng/mL respectively. Four levels of Quality Control Working Solution (QC WS) preparation, separate secondary stocks were prepared and QC WS were diluted to had the concentration 1.0, 3.0, 30.0 and 150.0 for Lower Limit of Quantitation QC (LLOQ QC), Low Quality Control (LQC), Medium Quality Control (MQC) and High-Quality Control (HQC) respectively. Internal Standard (IS) was chosen to be Solifenacin Succinate, one of the laboratory standards, and the Working Solution of the IS was prepared to have the concentration of 20 ng/mL. Sample preparation Sample Preparation was a one-step dilute and shoot. Into 900 µL Deionized Water, 50 µL of IS and 50 µL of each CCS/QC was pipetted into each sample. To be diluted twenty times than the working Solutions concentration. Those samples were prepared in 1.8 mL glass vials and after mixing they had placed in the autosampler of the LC. The final concentrations were as the following for Calibration Curve Standards (CCS) 0.05, 0.1, 0.25, 0.50, 1.00, 2.50, 5.00 and 10.00 ng/mL, and for Quality Control Samples (QC) 0.05, 0.15, 1.50 and 7.5 ng/mL respectively. Method performance check results For checking the performance of the method, precision and accuracy tests were conducted. Precision of an assay is defined as the closeness of the results when replicate assays of a test sample are carried out. The precision is expressed as %CV. The accuracy of a method is defined as the proximity of the determined values to actual concentrations of the samples. The accuracy is expressed as % accuracy. Both the inter-run and intra-run precision and accuracy were assessed by replicate analysis of samples containing known amounts of the Analyte (QCs). The results for inter-run and intra-run precision and accuracy tests of four replicate QC samples at LLOQ QC, LQC, MQC and HQC concentration levels are listed in TABLE 1 and TABLE 2. Assay sensitivity was assessed by precision (%CV), accuracy (%Nominal) and signal to noise (S/N) ratio at CCS1 concentration of all Calibration Curves. The results are listed in TABLE 3. 2
www.tsijournals.com | February-2018 TABLE 1.Accuracy results. QC Level of % Accuracy (n=4) Malathion I II III IV Overall LLOQ QC 104.5 98.7 110.6 103.3 104.3 (0.05 ng/mL) LQC 99.4 97.6 99.6 98.0 98.7 (0.15 ng/mL) MQC 110.7 103.9 101.6 103.7 105.0 (2.00 ng/mL) HQC 112.4 106.1 102.0 106.5 106.7 (7.5 ng/mL) TABLE 2. Precision results. QC Level of % CV (n=4) Malathion I II III IV Overall LLOQ QC 8.9 5.8 6.8 6.2 4.7 (0.05 ng/mL) LQC 2.8 2.2 3.9 1.2 1.0 (0.15 ng/mL) MQC 4.2 2.6 0.5 1.4 3.8 (2.00 ng/mL) HQC 2.7 3.0 2.9 2.5 4.0 (7.5 ng/mL) TABLE 3. Sensitivity results. n=4 PrAcc I PrAcc II PrAcc PrAcc IV Mean STD %CV % Accuracy III Concentration 0.053 0.052 0.052 0.053 0.052 0.001 1.4 104.8 Signal/Noise 94.6 84.8 62.0 71.7 - - - - 3
www.tsijournals.com | February-2018 Conclusion The developed method was proved to be fast and efficient, more over this method showed to be simple, rugged, sensitive and selective for the quantitative determination of Malathion in aqueous solution using liquid chromatography tandem mass spectrometry. Thus, this method can be used for widespread environmental analysis for determination of pesticides in water. Acknowledgement Darmantest Laboratories are acknowledged for the support and the help they provided to develop and process this method. REFERENCES 1.Adaway JE, Keevil BG, Owen LJ. Liquid chromatography tandem mass spectrometry in the clinical laboratory. Ann Clin Biochem. 2015;52:18-38. 2.Adaway JE, Keevil BG. Therapeutic drug monitoring and LC-MS/MS. J Chromatogr B Analyt Technol Biomed Life Sci. 2012;883:33-49. 4